

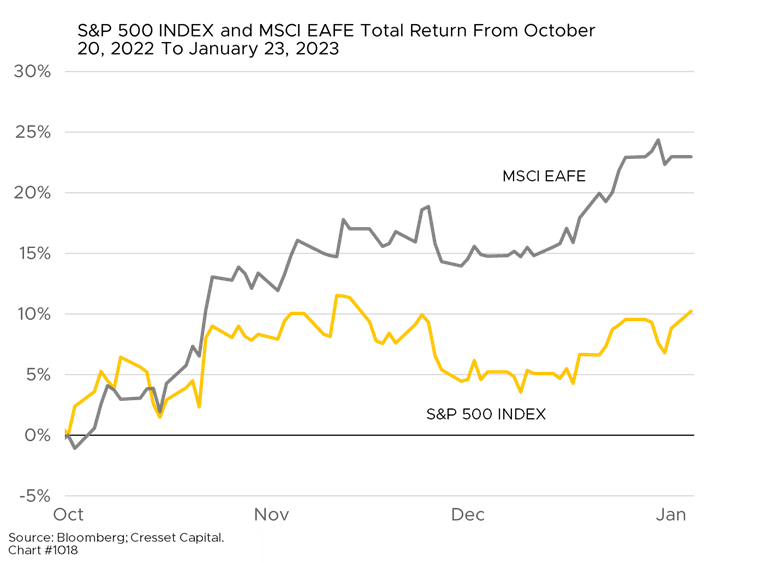
01.25.2023 International stock markets have been leading the way since the equity market bottom of last October. The likely catalyst was a decline in the dollar, reflecting investors’ view that a peak in Fed tightening is in sight. After steadily increasing, the projected peak Fed Funds rate has flatlined since October, thanks to favorable inflation readings. We use Cresset’s Five Factors when evaluating markets: valuations, the economic backdrop, liquidity, psychology and momentum. Taking those factors into consideration, we can see that international equity valuations are compelling relative to history. Are funds flowing in that direction?
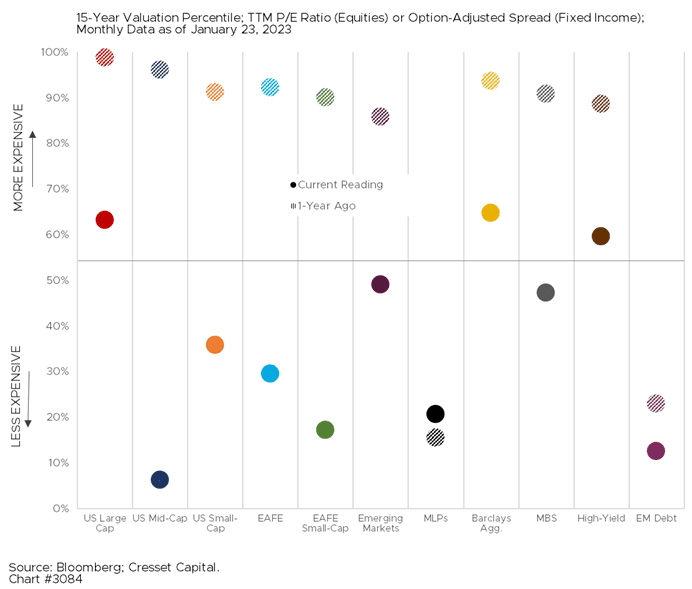
Higher intermediate rates last year compressed earnings multiples across all equity markets. The S&P 500 multiple slid to 17x from over 21x at the beginning of last year, placing it in the 63rd percentile of its 15-year valuation range, when tracking the ratio of its price to trailing 12-month earnings. International developed equities, however, ended 2022 in the 30th percentile of its 15-year range. Other equity asset classes that are cheap relative to their trailing earnings are mid-caps and EAFE small caps.
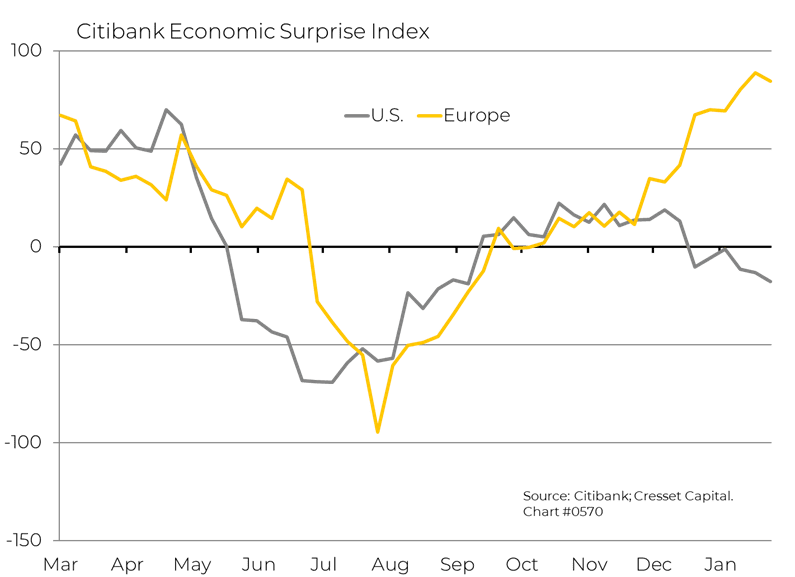
Economic conditions are fraught, and expectations are tepid for both the US and abroad this year. If 2022 was the year in which markets reacted to higher rates, 2023 will be the year in which economies respond to tighter financial conditions. Economists anticipate slower growth in the developed world, although they’re still penciling in positive numbers for the year. Thanks to low expectations, Europe’s economic data have been besting economists’ forecasts, due largely to a warmer-than-expected winter in Europe and adequate gas supplies so far.
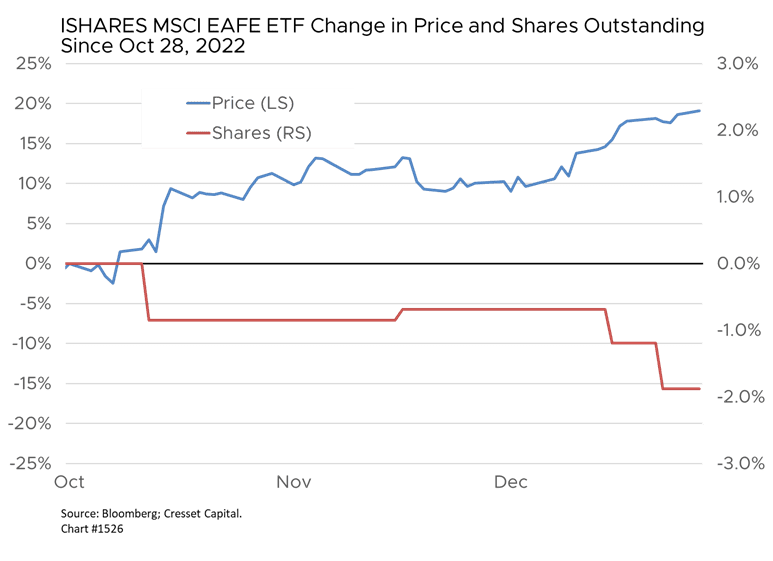
Liquidity remains a slight headwind for international developed markets. Notwithstanding the relative outperformance of US equities, investors are not shifting capital into international developed equities. Over the last three months the number of shares outstanding of one of the most popular international equity funds has fallen by nearly two per cent, suggesting that investors have not yet embraced the international equity thesis.
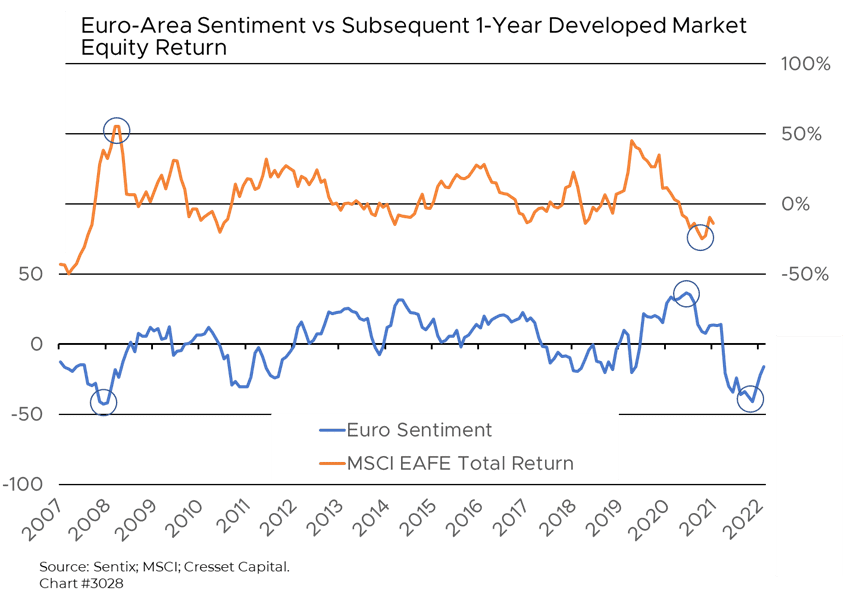
Psychology, like the economic backdrop in the developed world, is down but improving. Institutional investors who last year wouldn’t consider investing in Europe now appear to be warming up to the idea. Expectations remain dour, but history has shown that bearish investors with low expectations tend to be surprised to the upside, as our economic metrics suggest. History indicates extreme sentiment, both bullish and bearish, tends to serve as contrary market indicators.
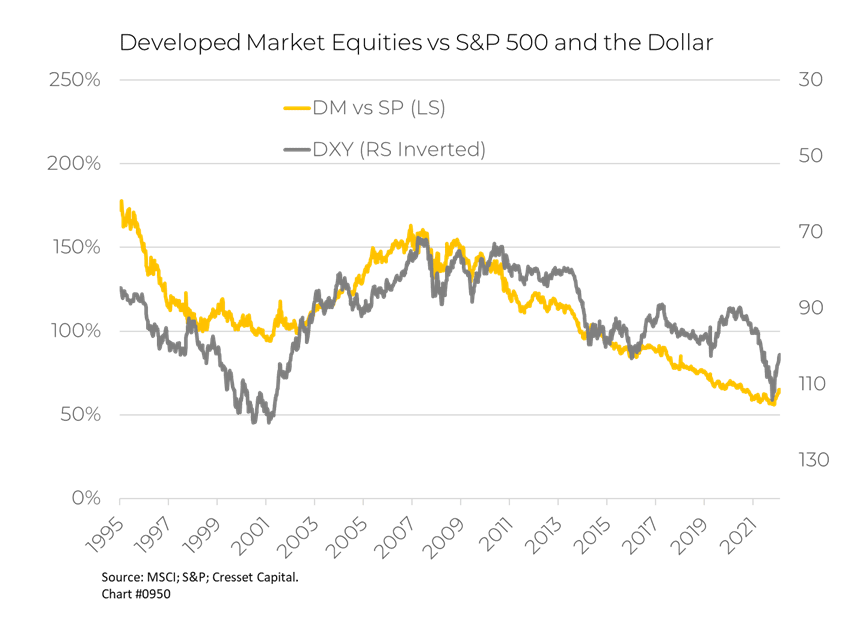
Unfortunately, the relative strength of foreign markets doesn’t have a strong track record of success as a gauge of future trends. The dollar, however, does: a weakening dollar serves as a tailwind to foreign markets, while a stronger dollar presents a headwind for them. The bull market in the greenback that began in July 2021 reversed earlier this year when the dollar’s 50-day moving average fell below its 200-day moving average, reversing a trend that historically lasts between 12 and 18 months. The catalyst this time was the perception the Fed is done tightening and will be passing the policy baton to foreign central banks, like the ECB.
In sum, a positive argument is beginning to coalesce for developed international equities. Our last hesitation is H1/23 earnings. As we stated earlier, 2023 will be the year in which the effect of higher interest rates will be felt in economies and on profits. We will be paying close attention to earnings reports and outlooks this season, looking for clues that the impact of higher interest rates on corporate profits will be muted. Until then, our gold positions continue to benefit from dollar weakness.