
09.20.22 Stocks rise and stocks fall. The good news: historically, equity markets have generally risen in four out of five years. When they fall, however, investors get rightfully upset. Equity market downdrafts come in three categories: technical, cyclical and systemic. This note examines where we are currently positioned on the downdraft spectrum.
Technical selloffs are also known as corrections. Often, equity market valuations get out of whack, sparked by optimism and fueled by momentum and greed. Eventually, markets correct back to fair value. Technical drawdowns are swift and can be painful, but markets typically regain their footing quickly. This year’s market drawdown, at least between January and June, was a technical selloff, sparked by a two per cent across-the-board rise in interest rates. The market selloff could have been predicted to the percentage point, given the steepest rise in rates since the 1980s.
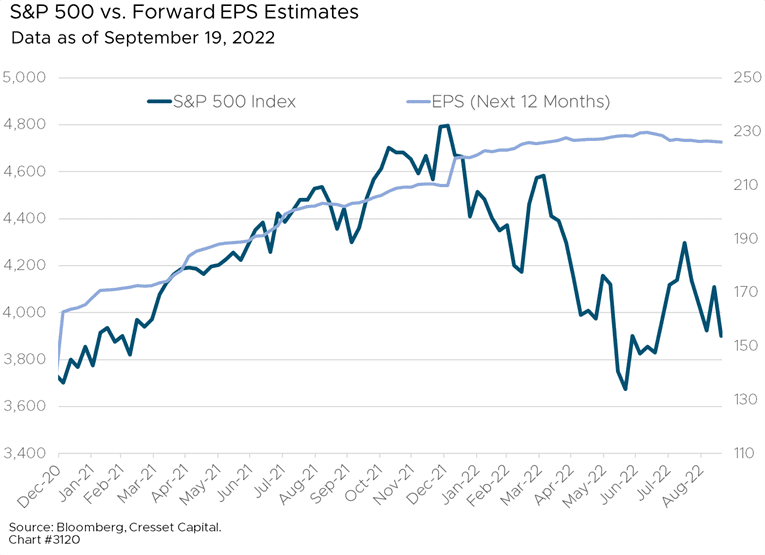
Cyclical drawdowns are often related to an anticipated recession. Economic growth pauses and declines lead analysts to slash earnings growth forecasts, the numerator of the equity valuation equation. The downdraft we have experienced since August is cyclical, as investors fret that higher-than-expected Fed-induced interest rates could lead to recession. Twelve-month forward S&P 500 earnings per share has flatlined for most of 2022, suggesting that analysts are remarkably sanguine in the face of a tighter Fed.
Systemic drawdowns are the most severe, as investors question the underpinnings of the financial system. The most recent systemic selloff occurred in 2007-2008 in response to the collapse of the housing bubble when the Federal Reserve allowed Lehman Brothers to default on its debt obligations. The 1973 bear market can also be considered systemic. The selloff was precipitated by the OPEC oil embargo, exacerbated by Watergate and, ultimately, by President Nixon’s resignation in August 1974. Investors may not have doubted the US banking system, but America’s faith in democracy was rattled. Including the two systemic pullbacks, the median market decline related to the previous seven recessions is 18 per cent, and taking nine months to recover.
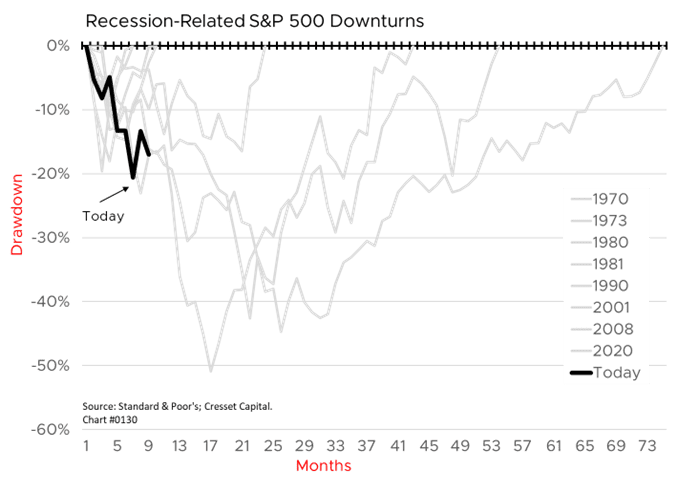
Systemic selloffs are much more dramatic than cyclical selloffs. Assuming 1973 was a systemic move, then our current drawdown — where we’re nine months into the selloff with the S&P 500 about 18 per cent lower — suggests we’re pretty well through what we would expect from a cyclical selloff, based on historical standards.

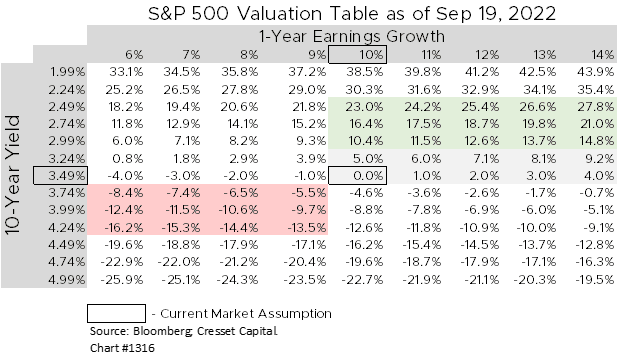
S&P valuations are derived from a combination of earnings growth expectations discounted by the 10-year, BBB corporate bond yield. The 10-year rate has a much bigger influence on valuations than do changes in earnings growth expectations. That means that if analysts mark down their forward earnings growth expectations due to an economic slowdown, it’s likely the 10-year interest rate would decline to more than offset any diminution on the profit front.