
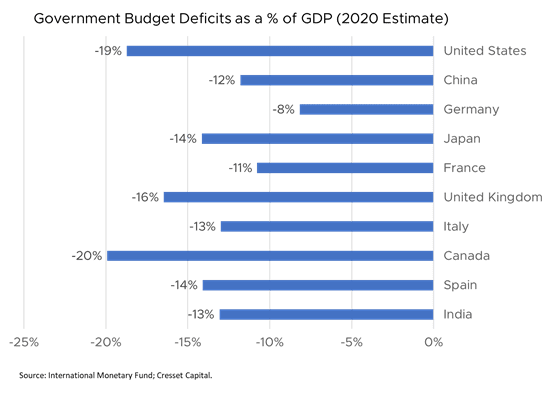
6/3/21: Fueled by the prospect of reopening, most major equity markets have enjoyed double-digit gains for the year so far. Virtually every developed market country, except Japan, has substantially fewer COVID-19 cases now than at the close of last year. US COVID-19 cases are down by 90 per cent; UK cases, by 93 per cent. India suffered a dramatic, 1600 per cent increase in cases between December 31 and early May, but even its infection rate has been cut in half since then. Government spending has picked up the slack left last year’s by business restrictions and stay-at-home orders, with all the largest economies running double-digit government deficits in 2020. Markets appear expensive. But interest rates are low, households are getting out and society is beginning to normalize, providing a demand boost the likes of which the world has not seen in decades. To assess where the investment markets really stand against this backdrop, we revisit Cresset’s Five Factors: valuation, the economic backdrop, liquidity, psychology and momentum.
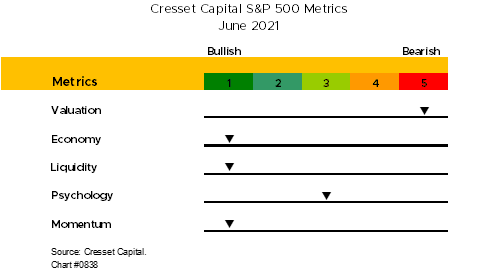
Valuation: Bearish
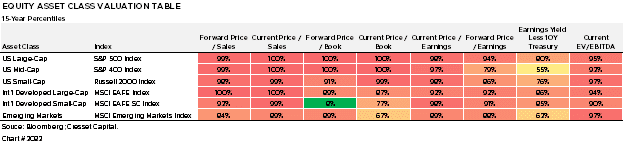
Equity markets across the globe are extremely expensive when gauged against history. In fact, on most measures, developed markets are trading in the top decile of their 15-year historical range, with emerging markets slightly below that. At the peak of the tech bubble, the S&P’s price-to-sales ratio was roughly two. Today, it’s nearly three. The only lens that helps equities to appear reasonably priced is bonds. That’s because the benchmark 10-year rate is near its lowest level in history. For example, the 100-year Santa Fe Railroad bond, issued in 1881, paid lenders 4 per cent, a generous yield by today’s standards. Most markets, particularly US Midcaps and EM, appear close to fair value when comparing their earnings yield to the 10-year Treasury yield. Valuation is not a timing tool, since expensive markets can get even more expensive in the near term. It is, however, a risk indicator, suggesting that returns over the next decade will likely pale in comparison to the 14 per cent annualized return we enjoyed over the last decade.
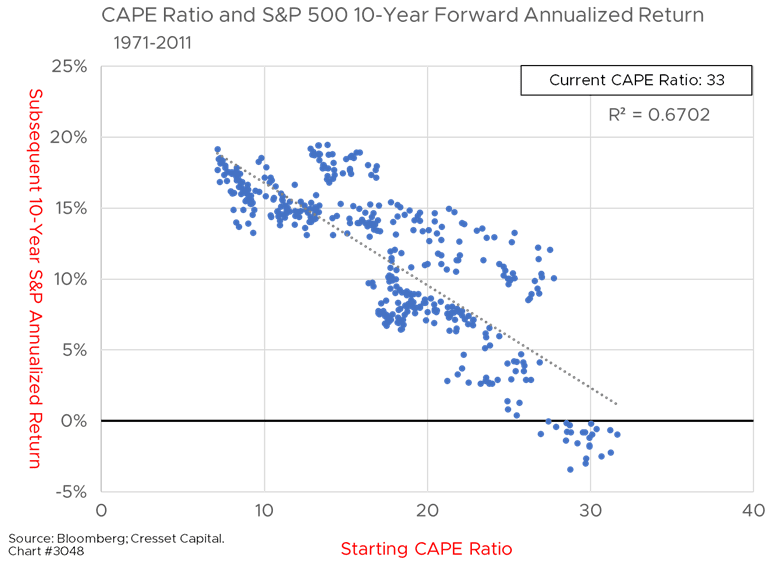
We at Cresset have found that both rich and cheap markets can reliably predict subsequent 7- and 10-year holding period returns. The cyclically adjusted price earnings ratio (CAPE), a measure popularized by Yale professor Robert Shiller, had an influential impact on the S&P 500’s subsequent 10-year returns, with lower PE ratios resulting in higher returns and vice versa. Today’s CAPE ratio of 33 suggests the next 10-year S&P 500 return will be negative. In fact, between 1971 and 2011, there has never been a period during which the market has delivered a positive 10-year return when the starting CAPE ratio was 27 or higher. Even more important, the only times over the 40-year study when the S&P declined over a 10-year holding period was when the starting CAPE ratio was over 27.
Economy: Bullish
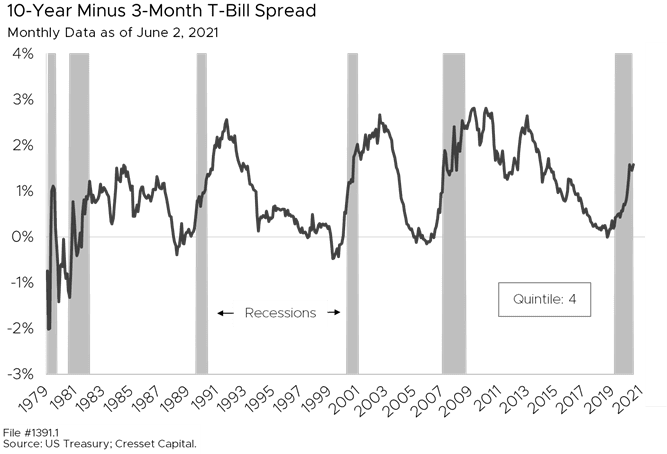
The economy is an environmental metric. Economic growth fosters increased revenues and profits, while recessions imply cost cutting and red ink. Nowadays, the economic backdrop is conducive to profit making. For this we can credit coincident factors, like growth related to reopening. Households worldwide saved an unprecedented portion of their incomes during the lockdown and now, armed with dry powder, they’re spending on travel, dining, entertainment and other activities they were forced to forgo last year. Piled on top of that is fiscal spending, with a series of checks being sent to individuals to supplement unemployment benefits and provide additional spending money. The yield differential between 10-year notes and 3-month bills offers real-time clues. The wider the differential, the stronger bond investors believe economic growth will be. Looking at historical data, every time the yield differential went negative, with the 10-year yield below that of 3-month bills, the economy fell into recession. Today, investors are penciling in stronger growth.
Liquidity: Bullish
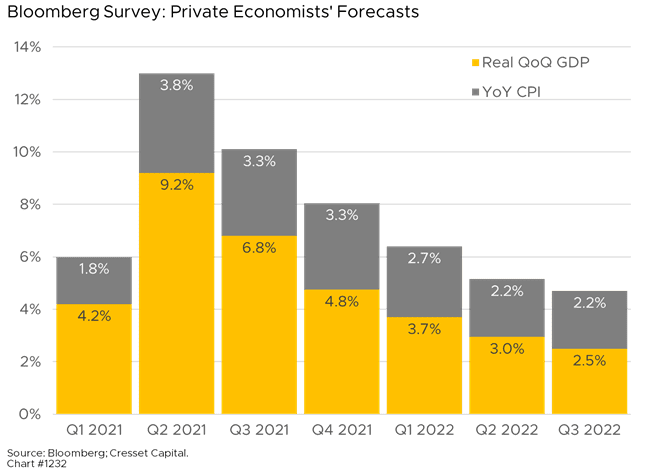
Liquidity – the availability of funds to borrow, spend and invest – is enormous. That’s due in large part to overly friendly Fed policy. Jay Powell & Company are holding interest rates artificially low, both short-term and intermediate-term maturities. The federal funds rate, which has tended to track inflation, is zero, and the Fed has pledged to keep it there through 2022. Meanwhile, the most recently reported year-over-year inflation rate was 4.2 per cent. The 10-year Treasury yield, which has tended to track nominal GDP, at 1.6 per cent yields substantially below current and projected nominal GDP growth. Nominal GDP is forecast to mushroom to 13 per cent this quarter before retreating toward 4 per cent next year. Clearly, a 1.6 per cent 10-year note is too low for economic conditions.
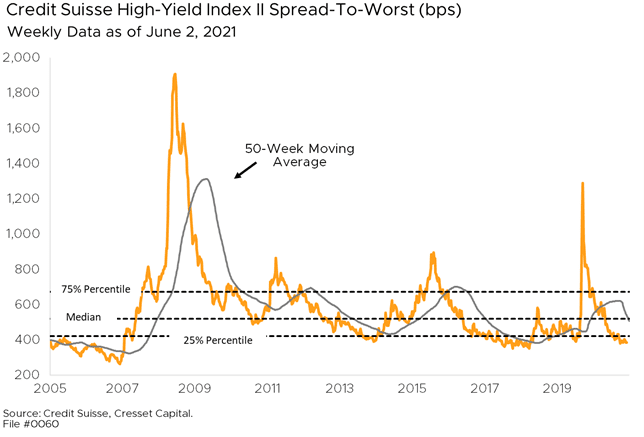
Thanks to strong economic activity and low interest rates, lenders are tripping over themselves to extend credit to strong and weak borrowers alike. The yield differential between high-yield bonds and US Treasuries is currently trading below the 25th percentile of its historical range. The only time credit conditions were easier than they are now was in the months leading up to the housing bubble in 2007. We’re not suggesting a bust is around the corner, but when liquidity conditions are this easy, it’s hard to imagine they could get easier from here. In other words, we’re likely on the liquidity North Pole where any step we take from here will be south.
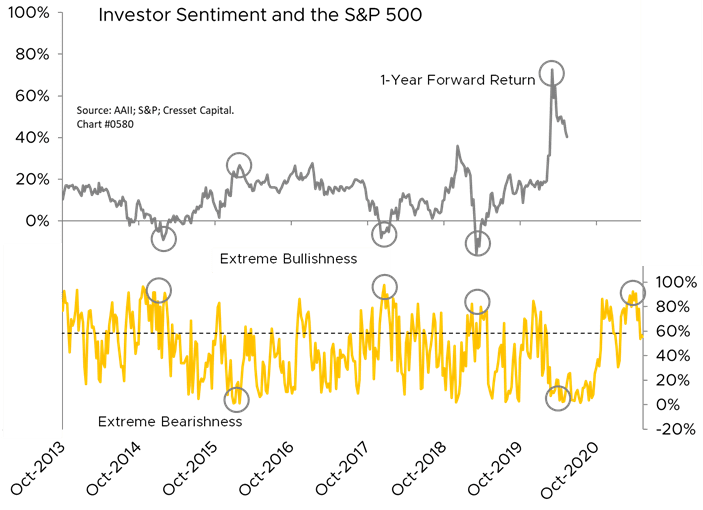
Psychology: Neutral
Psychology is a useful contrary indicator when investors are either wildly bullish or inconsolably bearish. Members of the American Association of Individual Investors (AAII) are ambivalent, with the bull-bear ratio at the 57th percentile of its historical range. Other measures, like closed-end fund activity, suggest stronger bullishness. The average top 10 closed-end, unlevered equity fund is trading at a 4.3 per cent discount to net asset value. That’s less than half the 9.4 per cent median discount, suggesting more aggressive buying here. Also, closed-end high-yield bond funds are trading above their median discount. Given the lack of a resounding view, either bullish or bearish, psychology currently has little influence on our market view.
Momentum: Bullish
Momentum is a powerful force in the markets’ near-term direction. As Sir Isaac Newton would have said if he had a quote machine, a market in motion tends to stay in motion unless otherwise acted upon. The market has traded consistently higher over the last year, fueled by monetary and fiscal stimulus and an expectation that widespread vaccine distribution would lead to an economic rebound. For those reasons, the S&P 500 has traded consistently above its 200-day moving average over the last 12 months. Additionally, the market’s 50-day moving average has traded above the 200-day moving average over the last year. Recent market action, including economic data and earnings reports, suggest the path of least resistance is higher.
Strategy Conclusions: Near-term bullish, longer-term concern
After a two-year boost of activity, we expect the economy to revert to its longer-term trend. In many respects, the fiscal spending we’re enjoying today is likely robbing the economy of longer-term growth by accelerating demand that should have occurred in future years. Americans are on pace to buy nearly 19 million automobiles this year, the highest number in over 20 years. We suspect the auto buying frenzy won’t spill too far into 2021. Once someone has a new car, it’s unlikely they’ll buy another one a year later.
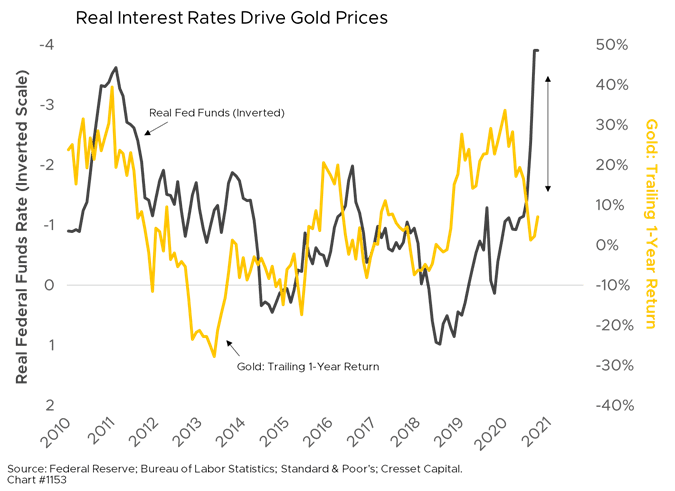
That doesn’t suggest, however, interest rates, where they’re currently situated, reflect present or future economic conditions. We believe an impending interest rate correction will test worldwide equity market valuations. At some point rates will test an upper limit, perhaps 2.8-3 per cent, before having to respond to a financial system and an economy that have become overly dependent on low rates. For that reason, we don’t anticipate sustained valuation contraction, but any future valuation expansion should probably be taken off the table for the time being. That means equity investors will have to rely on organic earnings growth and dividend yields to fuel future gains. From an earnings and dividend perspective, value-oriented equities are best positioned to outperform in an environment where we can’t rely on consistent valuation expansion. Meanwhile, gold will likely continue to outpace other financial assets as the Fed holds overnight rates at zero while the economy expands.