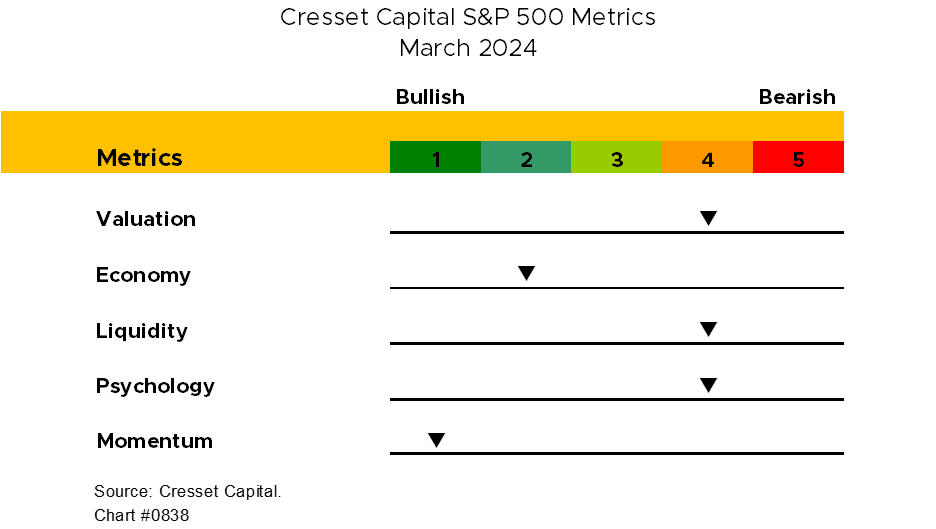

3.20.2024 Gauging the market is difficult. Data is everywhere and finding a time series to support your bullish or bearish predilections is easy. With so much data and opinions floating around, deductive reasoning, starting with a hunch and gathering supporting data, doesn’t make sense. We prefer to start with the data we trust first, and let it guide our conclusions rather than the other way around. Inductive decision making versus deductive decision making. Over the years, we identified five metrics, valuation, the economic backdrop, liquidity, psychology, and momentum, that have done a good job assessing markets relative to their histories and other markets. What are they telling us now?
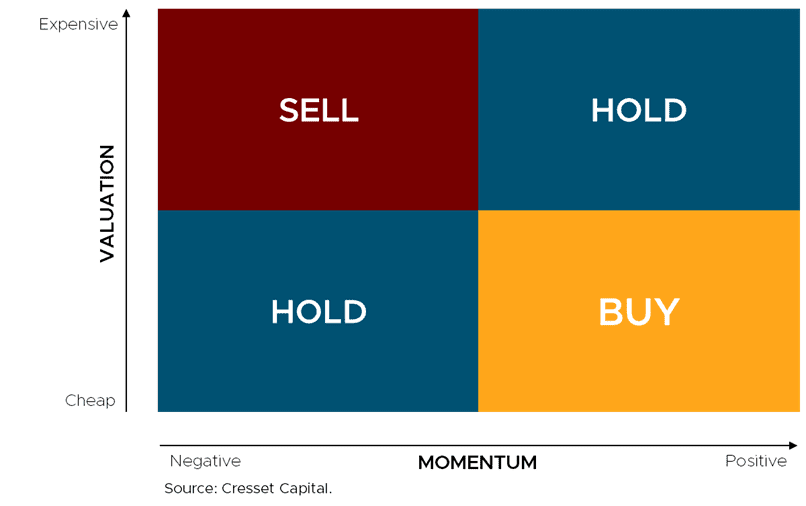
Valuation is one of the best metrics in evaluating the risk in the market at any given time. The problem is it takes too long to play out. History has shown that cheap markets can stay cheap and expensive markets can stay expensive. In fact, it typically takes nearly 10 years for today’s valuation to play out. The relationship between the cyclically adjusted price-earnings ratio (CAPE), a powerful valuation metric, and the subsequent return 10 years hence is powerful. Statistically speaking, valuation differences account for nearly 68% of the variation of the 10-year forward return. The current CAPE ratio, at 24 times, implies a 10-year annualized forward return of about 6%. The problem is the relationship between valuation and short-term performance is essentially uncorrelated. Combined with other metrics, like momentum, valuation, along with our metrics, offer interesting guideposts to the market’s future direction. Cheap markets with positive momentum represent undervalued, new opportunities. Eventually, markets become victims of their own success and become expensive, but they don’t become sell candidates until they lose momentum.
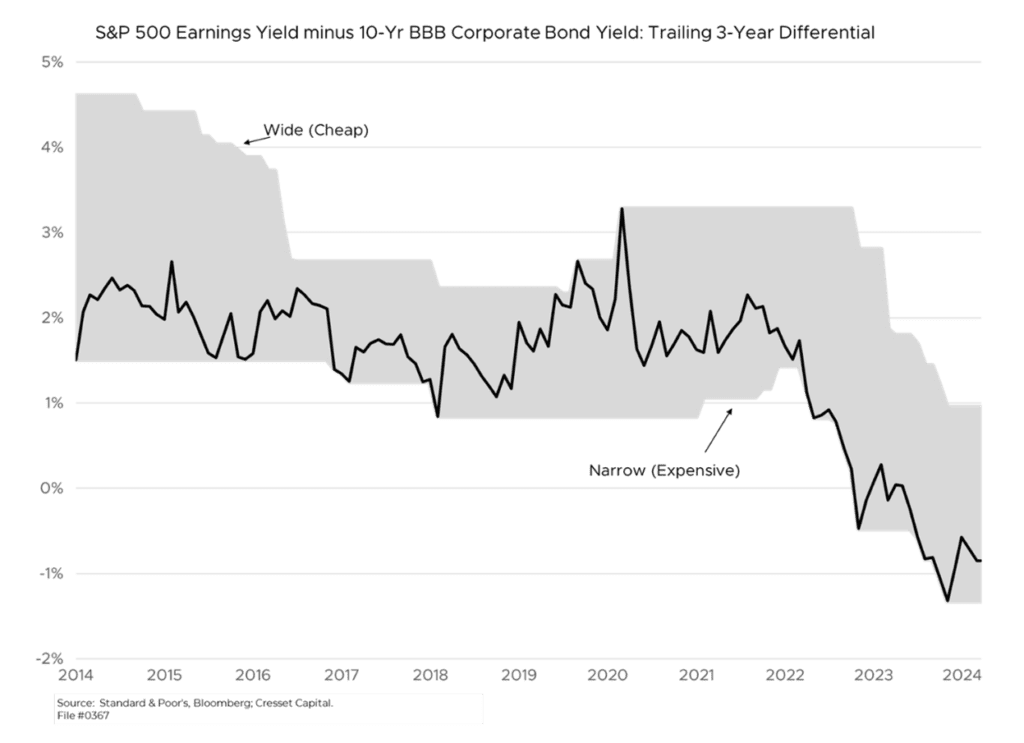
Other, shorter-term valuation measures confirm the S&P 500 is expensive. Comparing the S&P’s forward earnings yield to the 10-year, triple-B corporate bond yield is instructive. Historically, the bond yield and earnings yield trade in tandem. Although for more than a decade financial repression from the Fed, holding the 10-year yield artificially below fair value, distorted the stock-bond relationship., Since 2022, however, the relationship between corporate bonds at earnings yield snapped back in line. From that perspective, the S&P is expensive. Not only is the market’s forward earnings yield trading below that of the 10-year triple-B corporate bond yield, but it’s hanging near its 3-year low, underscoring how pricey stocks currently are, at least on a capitalization-weighted basis. The market’s largest names are largely to blame for its overvaluation. On an equal-weighted basis, the S&P 500 is close to “fair” value.
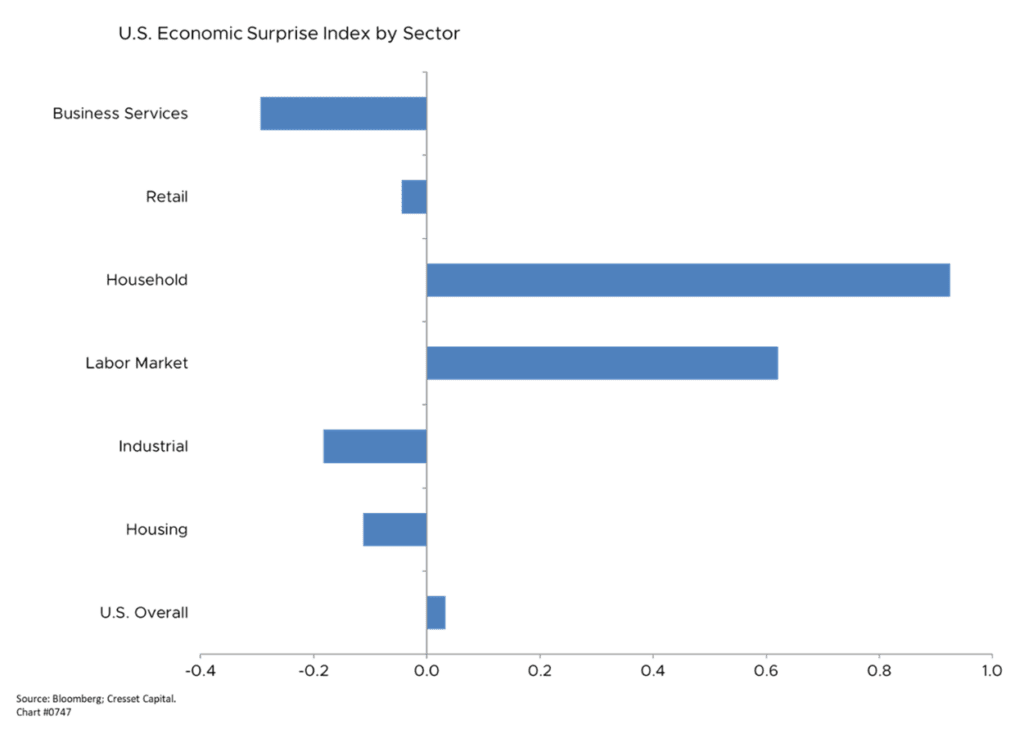
Economic Backdrop – The economic backdrop creates an environment for business activity and profit making. Today’s environment is slowing. Q4 2023 growth was positive, at 0.8% quarter-over-year, but down from 1.2% in Q3. Economic surprises, actual results versus economists’ expectations, paint a mixed picture. Retail sales and business spending are falling short of forecasts, while household balance sheets and the jobs market outpace expectations. High mortgage rates are weighing on housing market results.
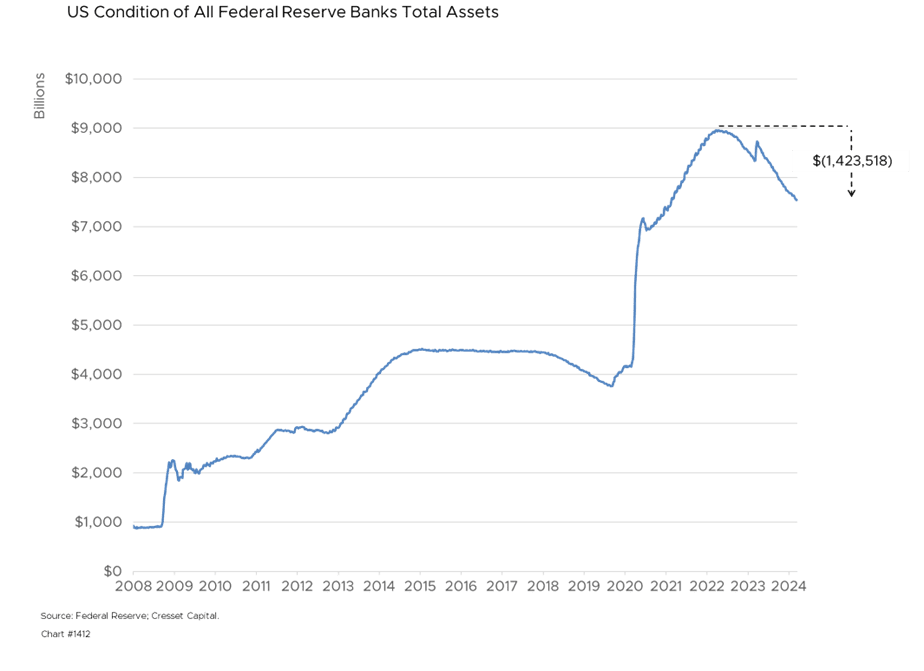
Liquidity – The availability of money to borrow, spend and invest represents the circulatory system of the economy. High interest rates make credit more costly, restricting liquidity flow and investment activity. Right now, liquidity is tight. Blame the mid-pandemic inflation flare up, but overnight rates are currently situated at their highest level since 2001. Real rates, overnight interest less inflation, is about 2%, it’s highest level since 2008. Stubbornly high inflation readings are keeping overnight rates higher for longer with the Fed debating three rate cuts this year, down from what was expected to be six cuts at the beginning of the year. At the same time, banks are tightening lending standards, making borrowing more difficult, although credit spreads on public bonds remain tight. Bank balance sheets are more than $1.4 trillion smaller than they were two years ago, dampening the supply of loanable funds.
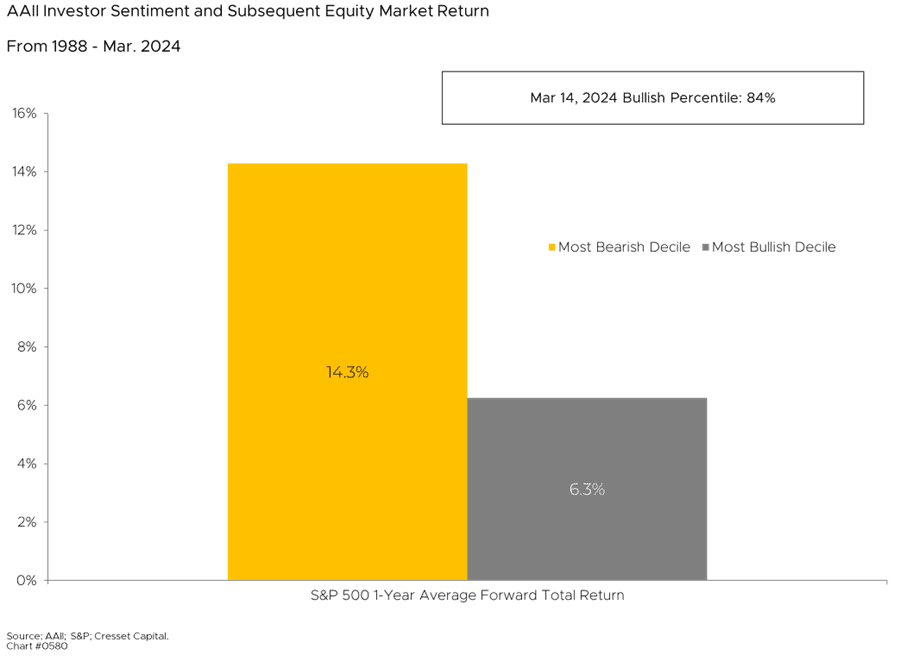
Investor sentiment, more of a spice than ingredient, is a useful contrary indicator, especially at extremes. We gauge the percentile ranking of self-declared bulls, according to the American Association of Individual Investors’ survey. Readings in the top decile suggest overbought conditions and the bottom decile, oversold. That’s because emotional investors carry extreme expectations and in a market that reflects the intersection of reality and expectations, widespread bearishness has historically proven to be a more valuable entry point. While bullishness is pervasive, it’s currently situated at 84%, below the top decile and therefore neutral. History has shown that investing in periods over widespread bearishness has been more profitable than buying in when optimism is running high.
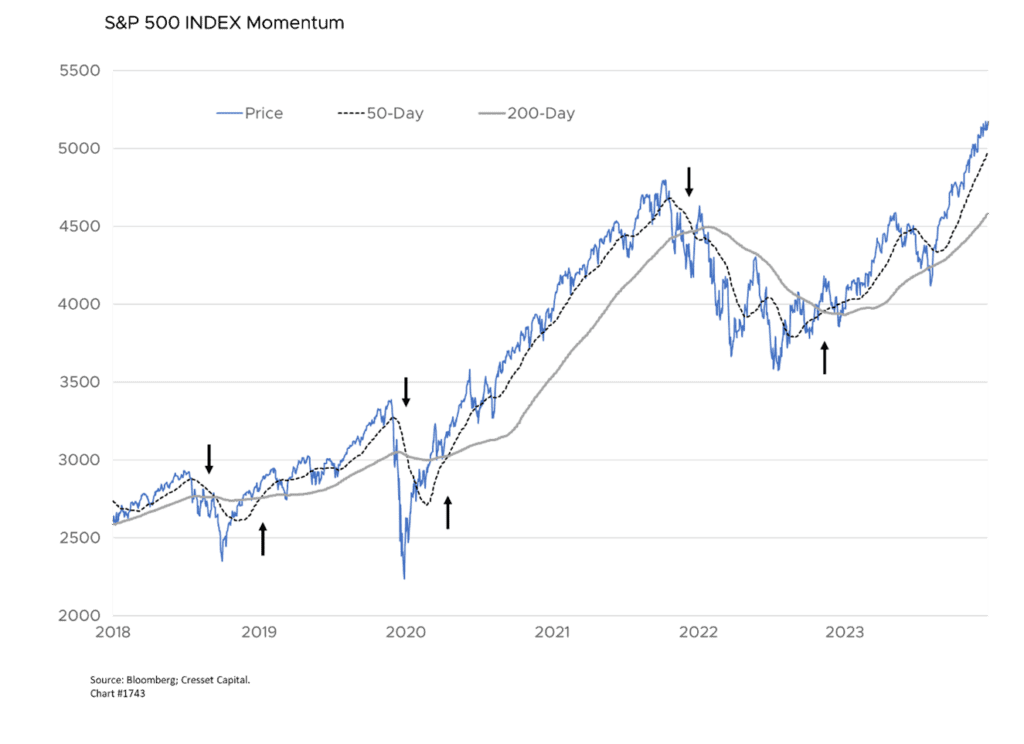
Momentum – A market in motion stays in motion unless otherwise acted upon. Sir Isaac Newton may not have been an investor, he must have had his finger on market movement. Price action reflects investor enthusiasm, or disdain. While momentum trading alone can lead to excessive turnover and missed opportunities, when coupled with valuation, its stature as a market metric is elevated. One of the easiest ways to measure market momentum is comparing the 50-day moving average against its 200-day moving average. Positive momentum when the 50-day is higher than the 200-day and vice versa. Thanks to positive market action over the last year, market momentum is markedly positive.
Bottom Line: The S&P 500 is expensive relative to its history and the bond market. Meanwhile, the investing environment is mixed, with the economy offering a gentle tailwind and liquidity incrementally restrictive. Momentum, moreover, remains positive, feeding on investor enthusiasm. For that reason, we recommend holding current equity positions. As always, we’re on the lookout for risks. Should overly optimistic investors become disappointed with market fundamentals, like weaker than expected economic data or earnings results, selling could prompt a momentum shift. For now, we recommend equity holders stay in and those on the sidelines consider put-writing as a disciplined approach to increasing your equity allocation.