11.14.2022 Investors were finally greeted with good news on the inflation front last week. The widely watched Consumer Price Index (CPI) cooled in October, offering hope that the fastest price increases in decades are ebbing and paving the way for the Federal Reserve to slow its steep interest rate hikes. Investors cheered as equities spiked higher and bond yields sagged. While the downtick in the CPI was certainly welcome, inflation remains uncomfortably high worldwide. We worry that, like in the case of COVID-19, the investment community optimistically expects inflation to simply disappear and trend toward 2019 levels. Just like COVID morphed from a pandemic to an endemic, investors would be wise to prepare for a future in which inflation readings remain elevated above central bank targets for several years.
The developed world is experiencing inflation readings at levels not seen in a generation, thanks to a combustible combination of lockdown-induced supply shortages and government spending. While the US suffers inflation in the sevens, Europe and the UK are dealing with double-digit year-over-year (yoy) price increases.
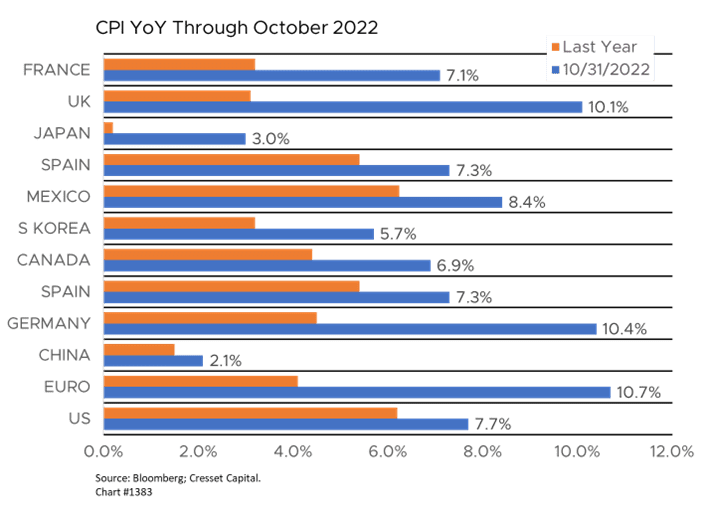
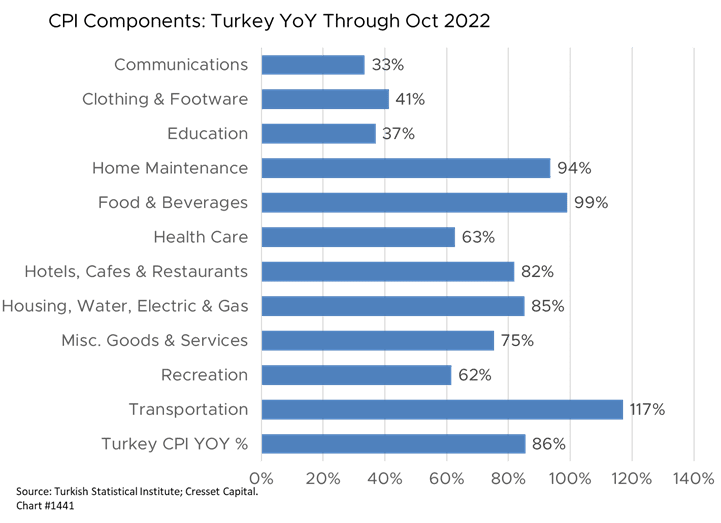
Food and energy prices are driving inflation higher in most of the world, while rents, vehicles, clothing and recreation are pushing prices higher here at home. Emerging countries are facing more severe pricing pressure, with yoy inflation in Turkey topping 85 per cent, punctuated by a staggering 117 per cent yoy rise in transportation costs.
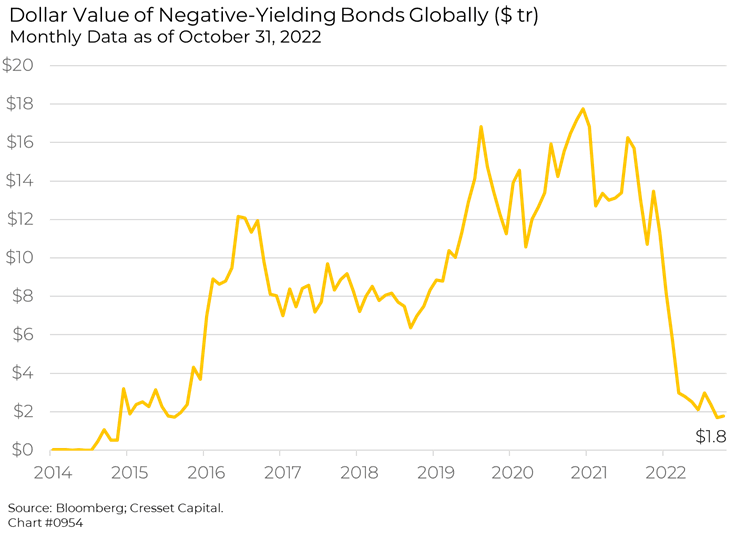
For the last decade or more, economists and policymakers have assumed inflation was dead, largely because inflation readings failed to exceed the Fed’s two per cent target in the eight years since 2008. In only three years did it exceed 2.5 per cent. In the interim, the US Federal Reserve, the Bank of England, the European Central Bank and the Bank of Japan collectively purchased more than $25 trillion in government bonds. By 2020, nearly $18 trillion of global bonds carried negative interest rates. Despite quantitative easing, debt monetization and negative interest rates, inflation readings remained tame, leading policymakers to believe it was better to run the risk of overstimulating the economy with high deficits and low interest rates than to fall short of their desired growth targets. They criticized Fed Chairman Bernanke and the Obama Administration for failing to enact sufficient monetary and fiscal stimulus in response to the 2008 financial crisis; a mistake that wouldn’t happen again. Underscoring that view, central bankers were emboldened by their track record of keeping a lid on inflation, leaving them overly confident.
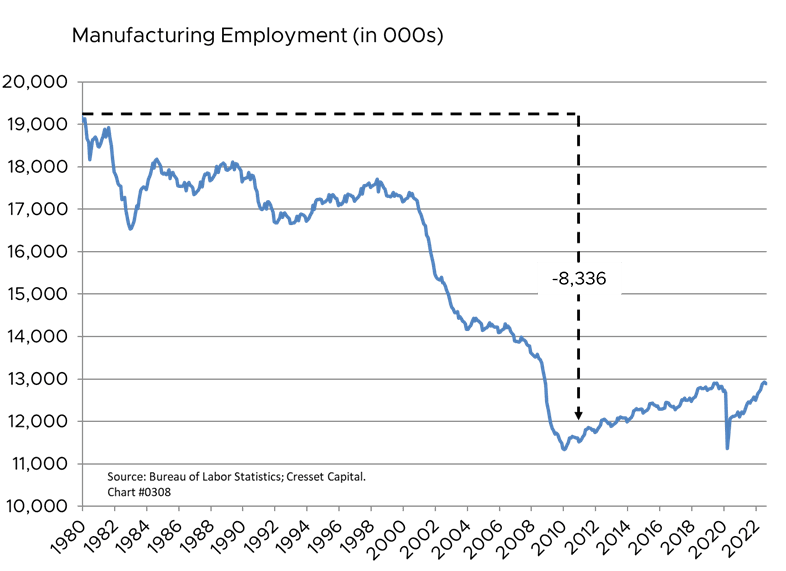
Globalization, deregulation and outsourcing were powerful forces pushing prices lower. Beginning in the early 1980s, President Reagan and Prime Minister Thatcher embarked on a period of deregulation and outsourcing that sent high-wage manufacturing jobs to low-wage countries. Developed-market consumers and companies benefitted at the expense of 8.3 million US manufacturing jobs. Globalization, however, reached its apex in the early 2010s and the incremental benefits of outsourcing flattened. Now, thanks to slowing growth, a global pandemic and supply shocks, nationalism is gaining popularity and the developed world is beginning to look inward. Any movement to reverse globalization trends will likely put upward pressure on price growth, just as globalization pushed them lower.
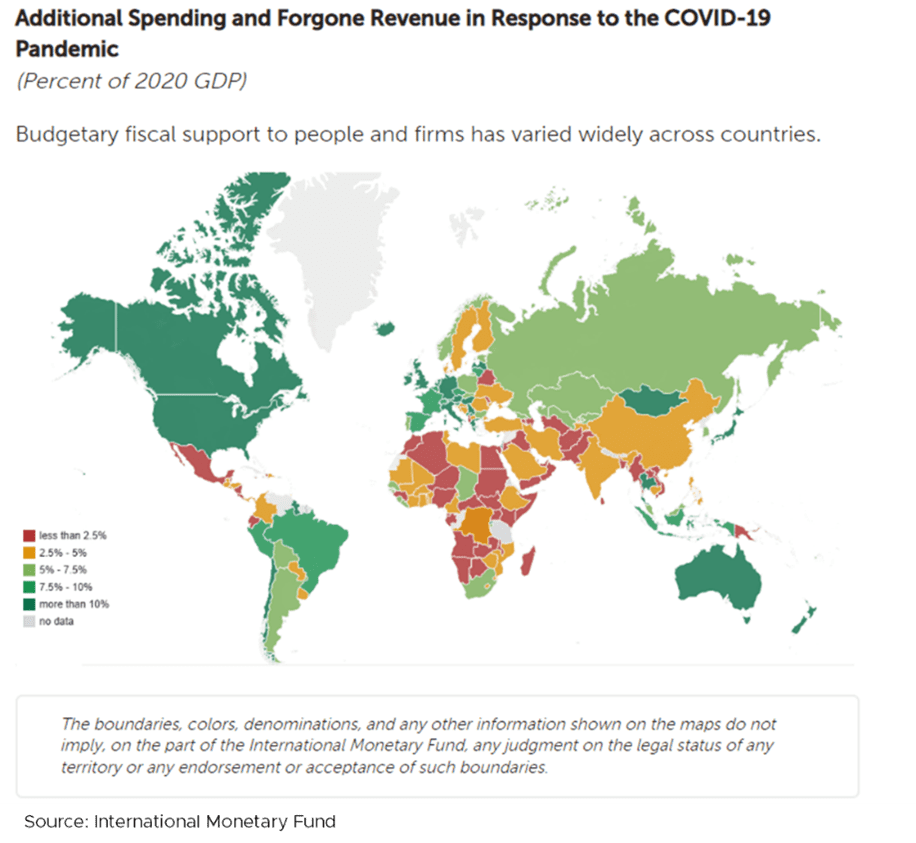
Developed-world governments have gotten more active, resulting in an increase in fiscal support that created unique challenges to central banks. Fiscal spending stagnated in the aftermath of the financial crisis, but the pandemic prompted governments to support households and businesses affected by lockdowns. For example, US policymakers spent a total of $7.5 trillion in 2020 and 2021, with most of the proceeds finding their way into household checking accounts. Developed-world governments spent at unprecedented (at least in peacetime) levels, more than 10 per cent of their gross domestic products (GDP) in COVID-related support in 2020.
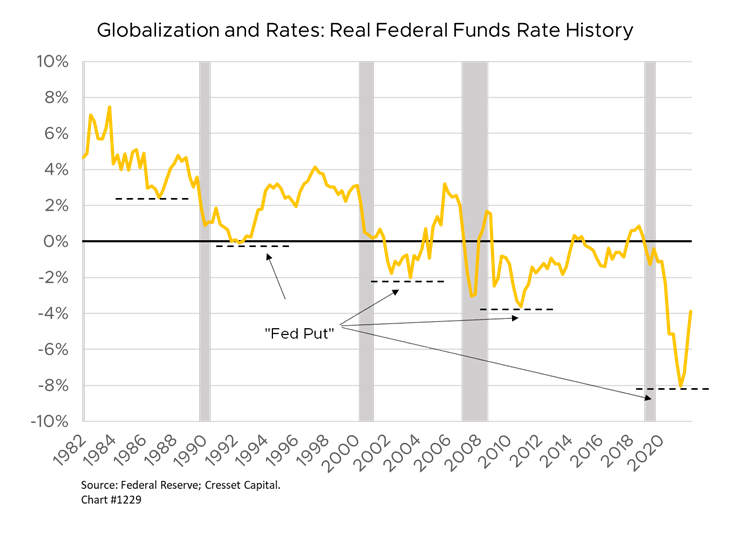
We believe the changing landscape could result in a new reality of more persistent and elevated inflation – not in the double digits, but certainly above most central banks’ two per cent target. This new reality would create issues for policymakers and risks for investors. Thanks to decades of stable prices, the “central bank put” – the willingness of monetary authorities to boost liquidity to prop up markets – carried few costs. Now, central banks are faced with a Solomon’s choice: fight inflation, or save their respective economies. UK and German policymakers are mulling these decisions in real time, opting to save their economies in exchange for tolerating higher inflation. We expect monetary policymakers to relax their two per cent targets, at least temporarily, accepting three percent inflation or higher in exchange for policy flexibility.
Fluctuating wages and prices represent another factor rendering monetary policymaking less powerful in the new environment, requiring more extreme rate hikes and cuts, and resulting in increased economic downside risk. Reversing the downward trend in real interest rates could also play out as fiscal deficits increase, increasing government financing costs. Government revenues track nominal GDP while, historically, intermediate government yields have stayed below inflation, allowing governments to grow out of their debts. Political and economic policy evolution make it unlikely the Fed can bring inflation back down to pre-pandemic levels. So it appears we’ve entered a new pricing regime.
Investment implications
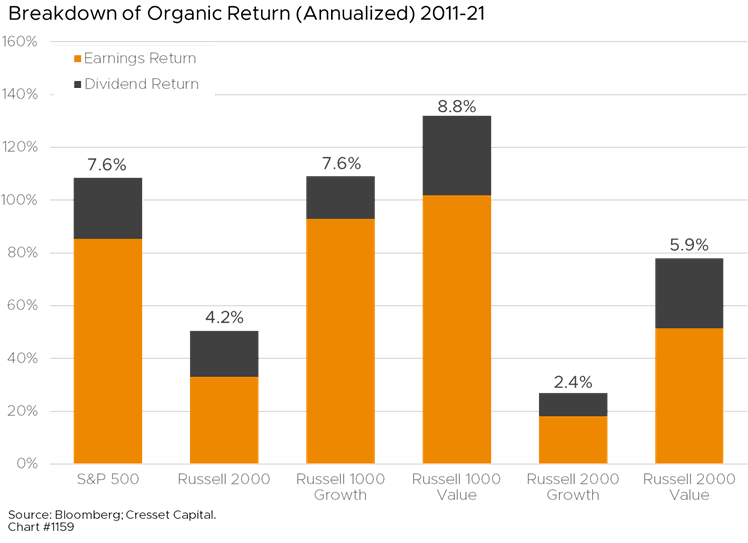
The prospect of endemic inflation alters the investment landscape, suggesting strategies that worked for the last 10 years will likely disappoint over the next 10 years. Stripping away valuation expansion, value-oriented sectors delivered stronger earnings and dividend returns relative to price than did growth sectors over the last 10 years and are likely best positioned to weather future price uncertainty. The difference was most dramatic among small-cap stocks. Moreover, equity investors should also consider adding food, energy and infrastructure exposure to their mix. Cresset is in the process of developing an equity strategy comprising companies with stronger-than-average pricing power, which are best positioned to maintain their margins in an environment of elevated inflation. We look forward to discussing this strategy with you in the coming weeks.
