Market Update 11/20/24: A Deep Dive Into Valuation
Market Commentary
Jack Ablin
By Jack Ablin, Chief Investment Officer. Subscribe for weekly market updates.
Key Observations:
By many measures, US large caps about 25 per cent overvalued
US stock market capitalization vs GDP near highest-ever level
S&P 600 have outpaced S&P 500 by five percentage points since early July, but remain relatively cheap
Small caps not immune to large-cap selloff, but favorable valuation would likely insulate investors.
No selloff catalyst on the horizon; our market metrics other than valuation are favorable
Equity market valuation is a useful tool for gauging risks and opportunities over multi-year holding periods. Valuation is not a timing tool, since expensive markets can remain expensive and cheap markets can remain cheap indefinitely. But eventually valuation wins out, as cheaper markets will outpace expensive markets over a 7-10 year holding period. US small caps are a recent example of this – they have been relatively cheap when measured against their large-cap counterparts since early 2021. And although the S&P 600 have outpaced the S&P 500 by five percentage points since early July, they remain relatively inexpensive. In this note we look at current market valuation from multiple angles and consider the implications.
By Many Measures, US Large Caps Are About 25 Per Cent Overvalued
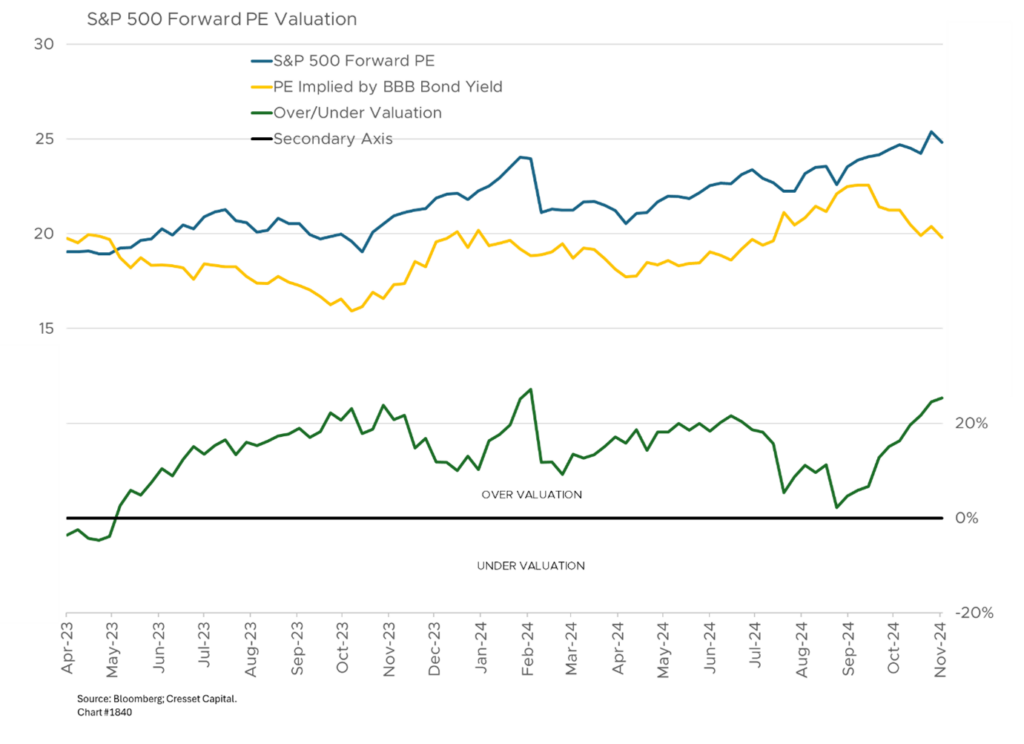
How expensive are US large caps? By several metrics, they appear to be more than 20 per cent overvalued. First, let’s look at the S&P 500’s forward P/E (price/earnings multiple) vs the forward multiple implied by the 10-year BBB bond yield. The corporate bond yield, at 5.05 per cent, implies an S&P forward P/E of around 20x. Yet today’s S&P forward PE is 25x, suggesting that the S&P 500 is 25 per cent overvalued.
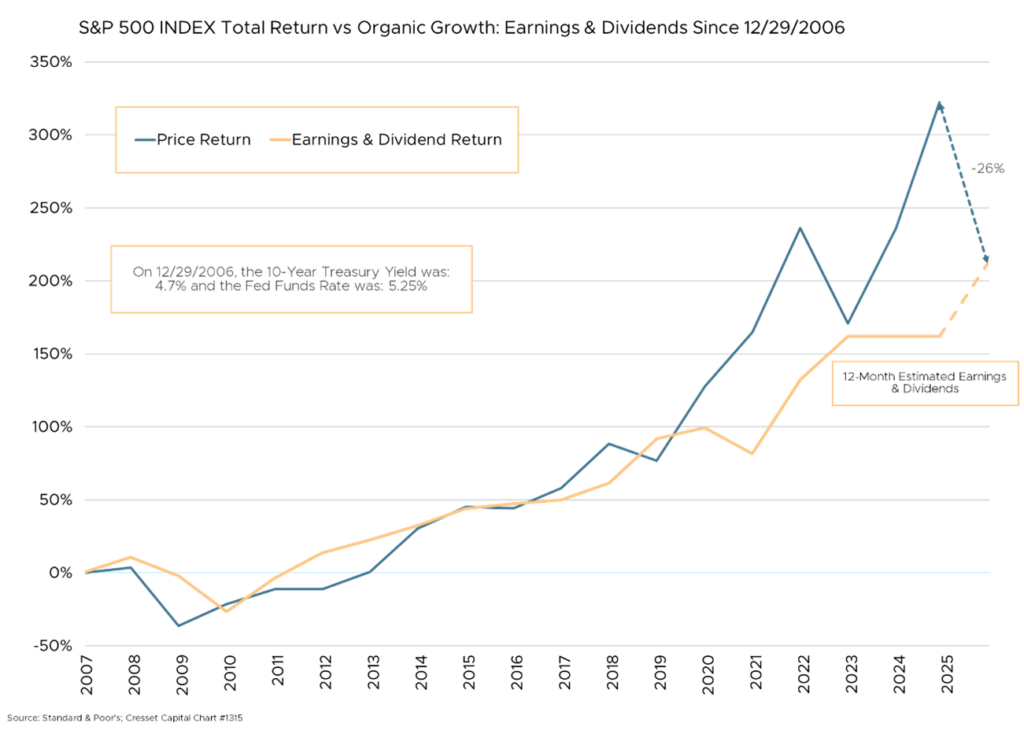
Gauging the S&P 500’s cumulative return against the cumulative growth in earnings and dividends since 2006, the last time interest rates were at the same level as today, confirms that view. That analysis, even anticipating the next four quarters’ earnings and dividends, suggests the S&P is 26 per cent overvalued.
US Stock Market Capitalization vs GDP Near Highest-Ever Level
Warren Buffet likes to compare the capitalization of the US stock market to the US economy. That measure also confirms our view. Historically, the total value of the US market remained below 150 per cent of US GDP, although post-pandemic it breached 200 per cent, thanks to a substantial economic contraction and investors anticipating an imminent economic rebound. Now, the Russell 3000’s market cap is back to more than twice that of US annual economic activity, which by longer-term standards is approaching its highest valuation in history. Having the market snap back to 150 per cent of GDP would also imply a 25 per cent market pullback from here.
CAPE Ratio Suggests S&P 10-Year Annualized Return Below Five Per Cent
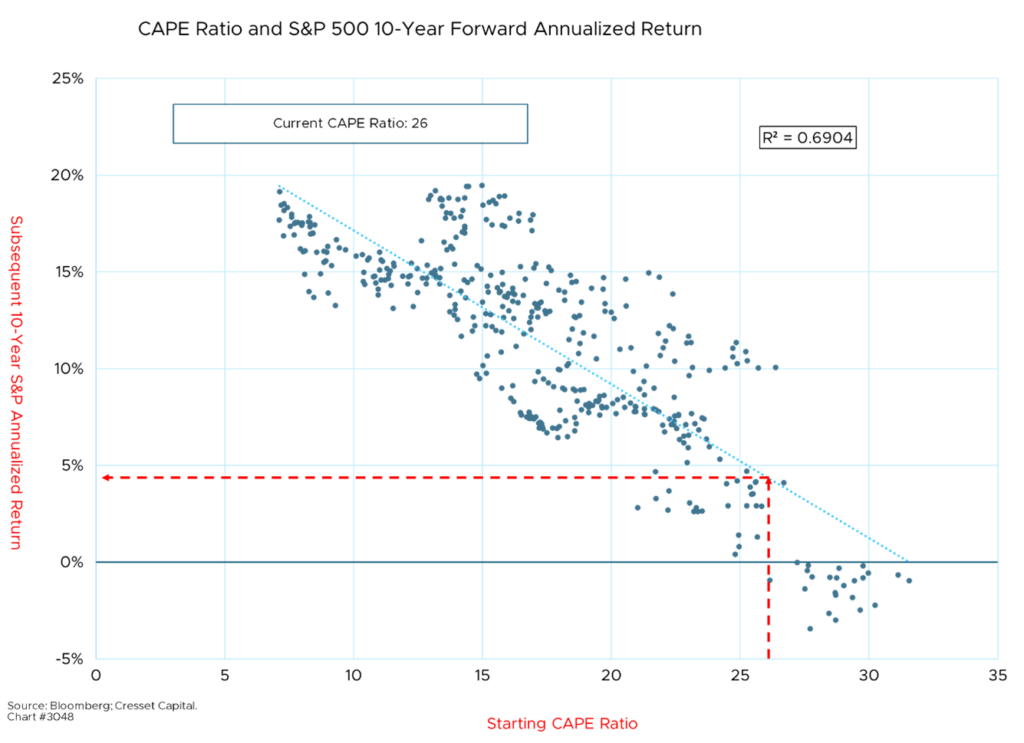
The cyclically adjusted price earnings (CAPE) ratio is another widely respected valuation gauge. Pioneered by Nobel laureate Robert Shiller, the CAPE ratio is calculated by dividing the current index price by the average inflation-adjusted earnings over the previous 10 years. It’s a useful tool for estimating the equity market’s long-term financial prospects. Historically, the market’s CAPE ratio has been a useful predictor of 10-year performance. In fact, the CAPE ratio explains nearly 70 per cent of the variation in the S&P 500’s subsequent 10-year annualized return, a strong statistic in financial market circles. At 26x, the current CAPE ratio is among the highest in history. The CAPE ratio exceeded 30x in June 2021 and March 2000. Thanks to its vertiginous starting point, this metric now suggests the S&P 500’s 10-year annualized return will be below five per cent.
Cheaper Stocks Get Sold Off, Too
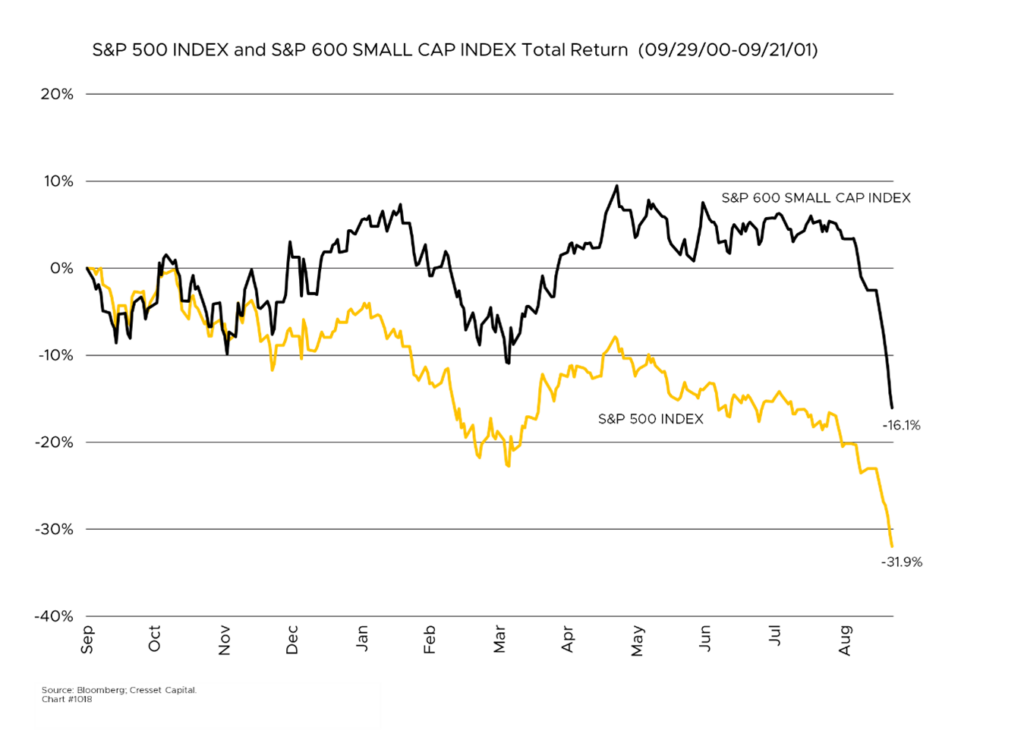
Unfortunately, valuation does not insulate relatively cheaper equity asset classes from market selloffs. The 2000 market is instructive, although we’re not calling for a replay of the tech bust. Entering the new millennium, the tech-heavy S&P 500 was expensive compared to other asset classes, like small caps, and to their own history. By the middle of 2000, large caps were trading at 27x their trailing earnings, a 50 per cent premium to small caps – high by historical standards. Fed rate hikes prompted tech selling and, between September 2000 and September 2001, the S&P 500 lost more than 30 per cent of its value. Small caps were also punished, losing more than 15 per cent, even though their market valuation was arguably cheaper.
Beyond Valuation, Our Other Market Metrics Remain Favorable
Economic activity is positive. The economy expanded at a 2.8 per cent annualized rate last quarter, with personal consumption contributing 2.5 percentage points of expansion. The odds of a recession over the next year are 25 per cent, according to the Bloomberg Recession Probability indicator. That’s down from 50 per cent as recently as January.
Liquidity is robust, as evidenced by lenders’ willingness to extend credit. The yield premium bond holders demand from investment-grade borrowers is penurious, suggesting they’re not worried about imminent delinquencies or defaults. Corporate bond spreads are currently trading at their lowest level since 2021 and well below the bottom quartile of their 20-year historical range.
Investor optimism, a contrary indicator, is not extreme. Sentiment is certainly bullish, but it’s relatively contained. Bullish sentiment, as measured by the American Association of Individual Investors (AAII) is currently situated at the 73rd percentile of its historical range, below the top decile threshold above which would be a concern.
Momentum is also positive. The S&P 500 is trading above its 50-day moving average and the 50-day is comfortably above the 200-day metric, suggesting strong momentum. Our momentum metric presciently turned negative in March 2022, a few weeks before US large caps turned down in earnest. The market lost nearly 12 per cent between the bearish signal and the end of the year. Momentum flipped positive in late January 2023 and remains favorably situated.
Bottom Line:
The market is undoubtedly expensive, but we don’t see a catalyst for a selloff on the horizon. Certainly not the Fed, at least in the near term. While Fed rate hikes sparked the tech selloff in 2000, the FOMC recently kicked off a rate-cutting program that investors expect will continue. Perhaps higher longer-term rates could spook investors. The 10-year Treasury yield has risen 0.8 per cent since the first Fed rate hike, pushing it toward the high of the year. We believe fair value for the 10-year Treasury yield is closer to five per cent than four per cent and we expect the rise in intermediate rates to continue. Quality US small caps are more favorably positioned from several perspectives. The S&P 600 shares are trading at a lower multiple than their large cap counterparts, even adjusted for history. Quality small caps are favorably positioned to benefit from economic expansion and US-centric policies.
LinkedIn
Print
About Cresset
Cresset is an independent, award-winning multi-family office and private investment firm with more than $60 billion in assets under management (as of 11/01/2024). Cresset serves the unique needs of entrepreneurs, CEO founders, wealth creators, executives, and partners, as well as high-net-worth and multi-generational families. Our goal is to deliver a new paradigm for wealth management, giving you time to pursue what matters to you most.
Market Update 11/20/24: A Deep Dive Into Valuation
By Jack Ablin, Chief Investment Officer. Subscribe for weekly market updates.
Key Observations:
Equity market valuation is a useful tool for gauging risks and opportunities over multi-year holding periods. Valuation is not a timing tool, since expensive markets can remain expensive and cheap markets can remain cheap indefinitely. But eventually valuation wins out, as cheaper markets will outpace expensive markets over a 7-10 year holding period. US small caps are a recent example of this – they have been relatively cheap when measured against their large-cap counterparts since early 2021. And although the S&P 600 have outpaced the S&P 500 by five percentage points since early July, they remain relatively inexpensive. In this note we look at current market valuation from multiple angles and consider the implications.
By Many Measures, US Large Caps Are About 25 Per Cent Overvalued
How expensive are US large caps? By several metrics, they appear to be more than 20 per cent overvalued. First, let’s look at the S&P 500’s forward P/E (price/earnings multiple) vs the forward multiple implied by the 10-year BBB bond yield. The corporate bond yield, at 5.05 per cent, implies an S&P forward P/E of around 20x. Yet today’s S&P forward PE is 25x, suggesting that the S&P 500 is 25 per cent overvalued.
Gauging the S&P 500’s cumulative return against the cumulative growth in earnings and dividends since 2006, the last time interest rates were at the same level as today, confirms that view. That analysis, even anticipating the next four quarters’ earnings and dividends, suggests the S&P is 26 per cent overvalued.
US Stock Market Capitalization vs GDP Near Highest-Ever Level
Warren Buffet likes to compare the capitalization of the US stock market to the US economy. That measure also confirms our view. Historically, the total value of the US market remained below 150 per cent of US GDP, although post-pandemic it breached 200 per cent, thanks to a substantial economic contraction and investors anticipating an imminent economic rebound. Now, the Russell 3000’s market cap is back to more than twice that of US annual economic activity, which by longer-term standards is approaching its highest valuation in history. Having the market snap back to 150 per cent of GDP would also imply a 25 per cent market pullback from here.
CAPE Ratio Suggests S&P 10-Year Annualized Return Below Five Per Cent
The cyclically adjusted price earnings (CAPE) ratio is another widely respected valuation gauge. Pioneered by Nobel laureate Robert Shiller, the CAPE ratio is calculated by dividing the current index price by the average inflation-adjusted earnings over the previous 10 years. It’s a useful tool for estimating the equity market’s long-term financial prospects. Historically, the market’s CAPE ratio has been a useful predictor of 10-year performance. In fact, the CAPE ratio explains nearly 70 per cent of the variation in the S&P 500’s subsequent 10-year annualized return, a strong statistic in financial market circles. At 26x, the current CAPE ratio is among the highest in history. The CAPE ratio exceeded 30x in June 2021 and March 2000. Thanks to its vertiginous starting point, this metric now suggests the S&P 500’s 10-year annualized return will be below five per cent.
Cheaper Stocks Get Sold Off, Too
Unfortunately, valuation does not insulate relatively cheaper equity asset classes from market selloffs. The 2000 market is instructive, although we’re not calling for a replay of the tech bust. Entering the new millennium, the tech-heavy S&P 500 was expensive compared to other asset classes, like small caps, and to their own history. By the middle of 2000, large caps were trading at 27x their trailing earnings, a 50 per cent premium to small caps – high by historical standards. Fed rate hikes prompted tech selling and, between September 2000 and September 2001, the S&P 500 lost more than 30 per cent of its value. Small caps were also punished, losing more than 15 per cent, even though their market valuation was arguably cheaper.
Beyond Valuation, Our Other Market Metrics Remain Favorable
Economic activity is positive. The economy expanded at a 2.8 per cent annualized rate last quarter, with personal consumption contributing 2.5 percentage points of expansion. The odds of a recession over the next year are 25 per cent, according to the Bloomberg Recession Probability indicator. That’s down from 50 per cent as recently as January.
Liquidity is robust, as evidenced by lenders’ willingness to extend credit. The yield premium bond holders demand from investment-grade borrowers is penurious, suggesting they’re not worried about imminent delinquencies or defaults. Corporate bond spreads are currently trading at their lowest level since 2021 and well below the bottom quartile of their 20-year historical range.
Investor optimism, a contrary indicator, is not extreme. Sentiment is certainly bullish, but it’s relatively contained. Bullish sentiment, as measured by the American Association of Individual Investors (AAII) is currently situated at the 73rd percentile of its historical range, below the top decile threshold above which would be a concern.
Momentum is also positive. The S&P 500 is trading above its 50-day moving average and the 50-day is comfortably above the 200-day metric, suggesting strong momentum. Our momentum metric presciently turned negative in March 2022, a few weeks before US large caps turned down in earnest. The market lost nearly 12 per cent between the bearish signal and the end of the year. Momentum flipped positive in late January 2023 and remains favorably situated.
Bottom Line:
The market is undoubtedly expensive, but we don’t see a catalyst for a selloff on the horizon. Certainly not the Fed, at least in the near term. While Fed rate hikes sparked the tech selloff in 2000, the FOMC recently kicked off a rate-cutting program that investors expect will continue. Perhaps higher longer-term rates could spook investors. The 10-year Treasury yield has risen 0.8 per cent since the first Fed rate hike, pushing it toward the high of the year. We believe fair value for the 10-year Treasury yield is closer to five per cent than four per cent and we expect the rise in intermediate rates to continue. Quality US small caps are more favorably positioned from several perspectives. The S&P 600 shares are trading at a lower multiple than their large cap counterparts, even adjusted for history. Quality small caps are favorably positioned to benefit from economic expansion and US-centric policies.
About Cresset
Cresset is an independent, award-winning multi-family office and private investment firm with more than $60 billion in assets under management (as of 11/01/2024). Cresset serves the unique needs of entrepreneurs, CEO founders, wealth creators, executives, and partners, as well as high-net-worth and multi-generational families. Our goal is to deliver a new paradigm for wealth management, giving you time to pursue what matters to you most.