Key Observations
- Stock volatility falls more rapidly than bond volatility after Election Day
- High-quality US small caps best performers immediately post-elections
- S&P does well post-election whether or not incumbent wins
- International equities tend to rise on weaker dollar before Inauguration Day
Election time carries unique challenges for investors every four years, particularly when it looks like a tossup. The binary outcome ascribed to the first Tuesday in November every four years leaves a few patterns worth noting. In this note we discuss historical patterns between Election Day and Inauguration Day in risk/volatility, US large caps, high-quality US small caps, and international equities.
Stock Volatility Falls More Rapidly Than Bond Volatility After Election Day
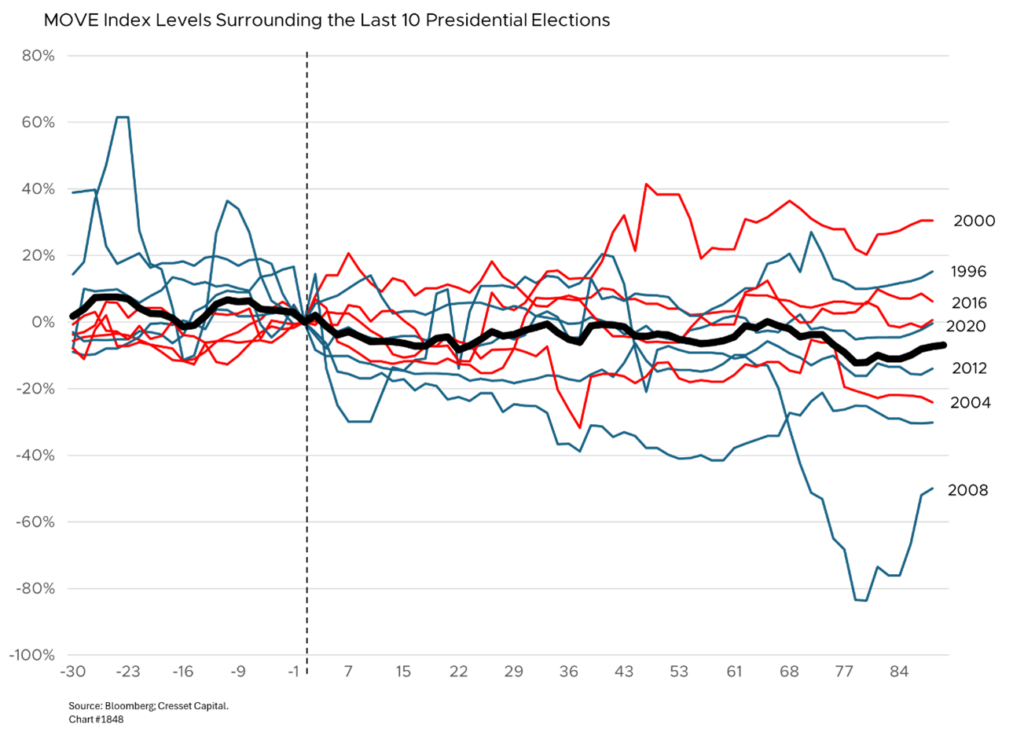
Let’s start with risk. In 2016 it became clear that pollsters, who rely on prospective voters to answer their phones, have had it wrong. Since then, investors have treated election days as a coinflip, and that’s reflected in bond and stock market volatility readings, which are good proxies for uncertainty. Like during the runup to the 2020 election, the bond market experienced increased volatility (MOVE Index) ahead of this year’s voting day. History suggests bond volatility will settle down once a candidate is selected, although this year traders must also consider a Federal Reserve rate-setting meeting scheduled for later this week.

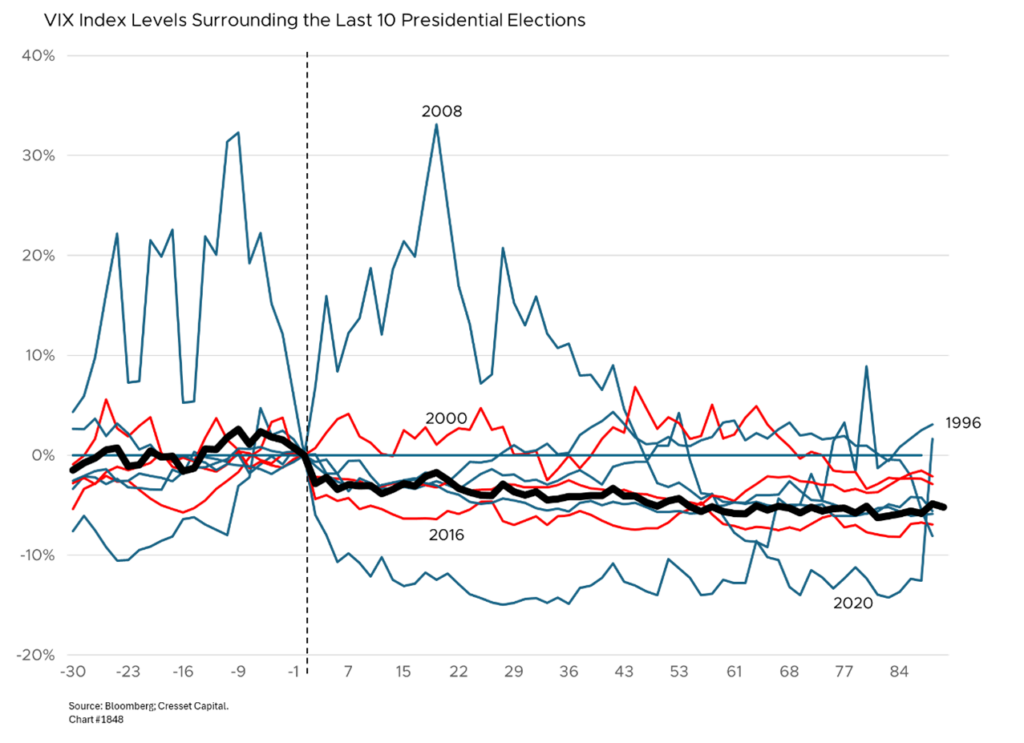
Stock market volatility (as measured by the VIX Index) follows a pattern similar to that of bonds: elevated entering election day and declining once the president is selected. Stock volatility then falls relatively more than bond volatility, paving the way for risk taking between Election Day and Inauguration Day.

S&P Performs Well Post-Election Whether or not Incumbent Wins
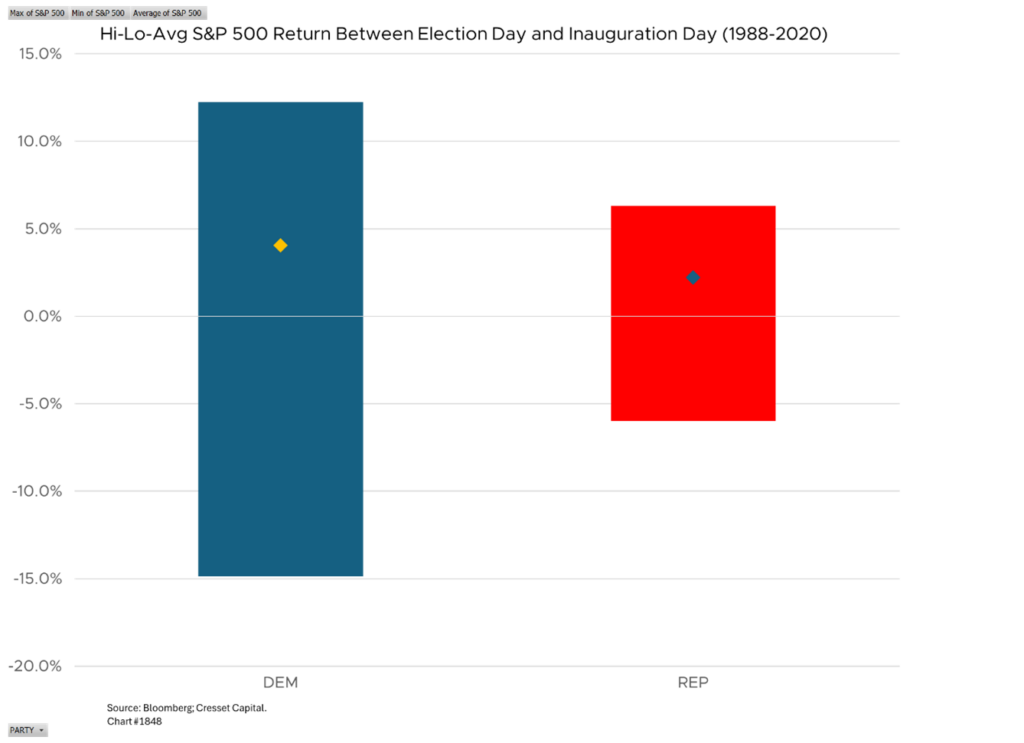
The S&P 500 performs well, on average, between Election Day and Inauguration Day, with a 4.8 per cent median gain for all presidential elections back to 1988. Going back to 1900, US stocks gained an average of 4.4 per cent between Election Day and Inauguration Day when the incumbent party won and fell an average of two per cent when the party in the White House turned over, according to MarketWatch. Moreover, the market was lower 62 per cent of the time when the incumbent party lost and 28 per cent of the time when the incumbent party won. Democrats enjoy a slightly higher market gain between Election Day and Inauguration Day back to 1988, averaging a 4.1 per cent advance versus a 2.2 per cent gain for Republicans, although the range in returns is higher for Democrats, thanks to the 2008 financial crisis adding to the downside and the pandemic reopening around Election Day 2020 adding to the upside.

International Equities Tend to Rise on Weaker Dollar Before Inauguration Day
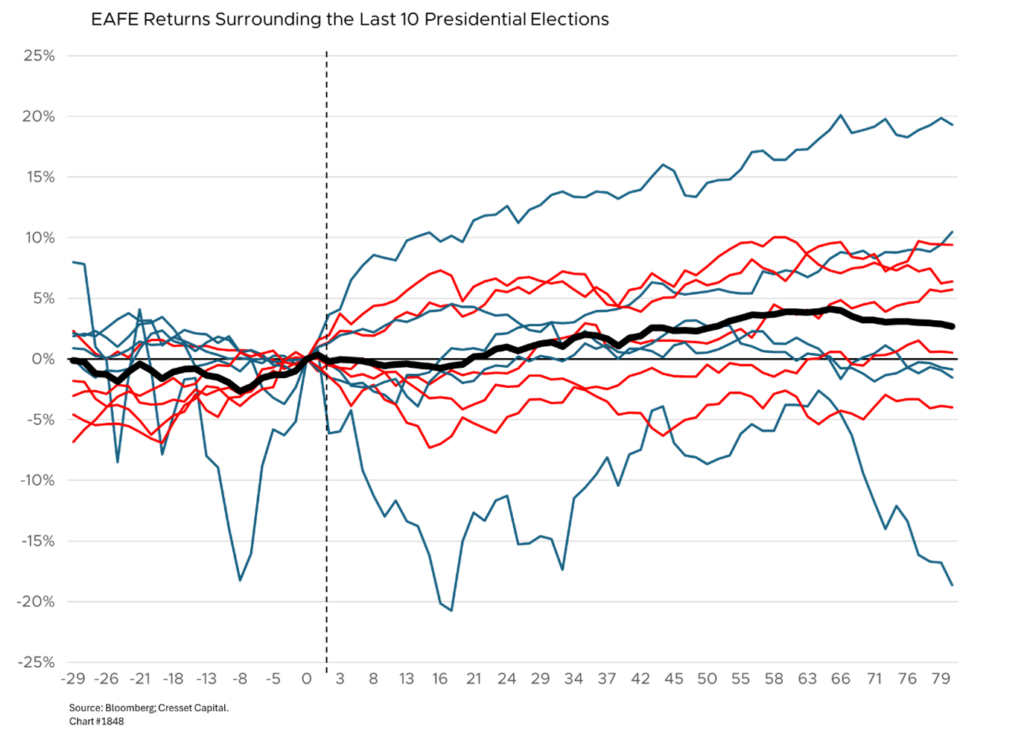
International equities tended to rise into the election also, although they treaded water for the remainder of the year and before pushing incrementally higher toward Inauguration Day. Between Election Day and Inauguration Day, the average return for international equities was higher under Republicans, up 3.3 per cent, than it was for Democrats, up 2.9 per cent. The dollar tends to fall slightly by Inauguration Day, providing a slight tailwind for non-dollar equities.

High-Quality US Small Caps Best Performers Immediately Post-Elections
High-quality US small caps (S&P 600) tend to be the best-performing equity sector in the days following a presidential election. The S&P 600 advanced in six of the last seven elections in the 90 days following elections, with 2008 the notable exception. Going back to 1996, the S&P 600 enjoyed a median 8.7 per cent return between Election Day and Inauguration Day, outpacing all major equity asset classes, although with a higher high and a lower low than their counterparts.

Bottom Line
As of this writing, we don’t know the outcome of the election. Using history as a guide, some investors, like some voters, will be disappointed by the election outcome. Others will be emboldened. Either way, one big uncertainty overhanging the market will be lifted, allowing investors and Americans to focus on the future.

