Market Update 12/11/24: When Valuation Says ‘Sell’ but Momentum Says ‘Buy’
Market Commentary
Jack Ablin
By Jack Ablin, Chief Investment Officer. Subscribe for weekly market updates.
Key Observations:
Stocks now 20%+ overpriced, with 10-year forecast return below BBB bond yield
Valuation is not a timing tool
Momentum can spot when a market starts to slip
Momentum plus valuation is an important timing tool, particularly in an expensive market
Longer-term, tax-insensitive investors should tilt away from equities, or at least rebalance back to strategic targets; shorter-term investors should monitor momentum
How should investors approach a market in which valuation says “sell” but momentum says “buy”? Traditional valuation measures suggest the S&P 500 is currently more than 20 per cent overvalued, yet trend-following measures, like momentum, remain strong. Let’s break it down.
Thanks to a terrific two-year run, the S&P 500 has become a victim of its own success. US large caps are more than 60 per cent higher since the beginning of 2023, with earnings advancing a little more than 16 per cent in the interim, leaving the blue-chip index expensive from several perspectives.
Stocks 20%+ Overpriced, with 10-year Forecast Return Below BBB Bond Yield
Gauging stocks through the lens of bonds suggests the market is more than 20 per cent overpriced. The S&P 500’s earnings yield – the reciprocal of its price/earnings (P/E) ratio – is lower than that of an intermediate-maturity corporate bond, giving bonds the edge in the clamor for capital. The P/E multiple implied by the BBB corporate bond yield suggests the S&P 500 should trade at a multiple of 20x. The index currently trades at 25x next year’s estimated earnings.
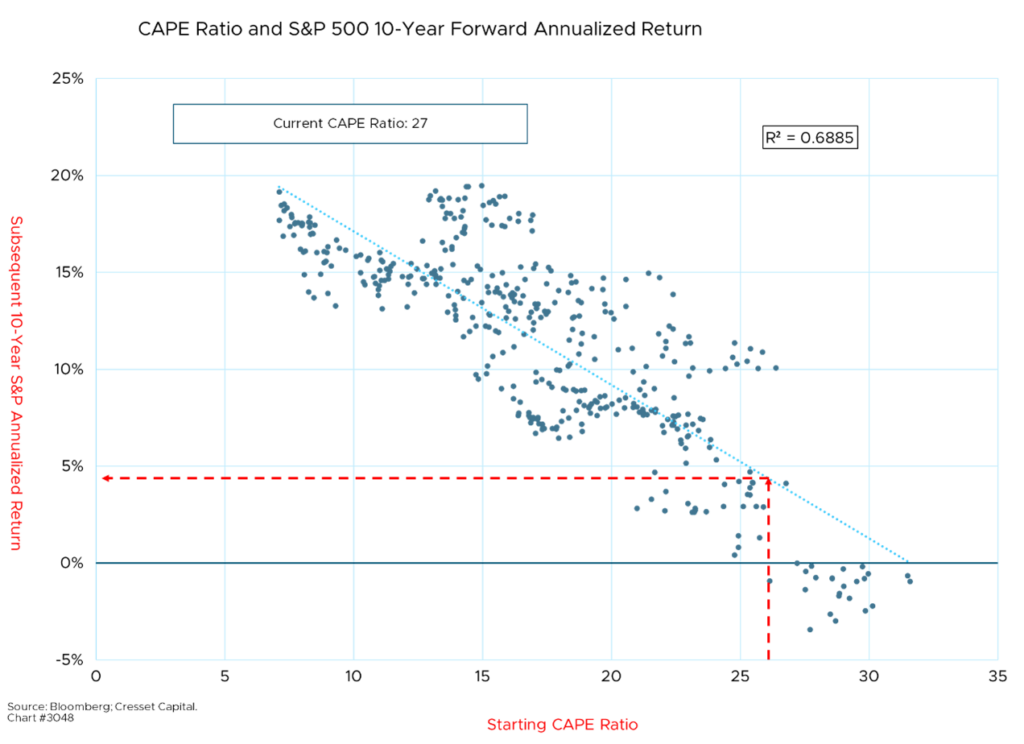
Looking at it another way, the market’s cyclically adjusted price/earnings ratio (CAPE), a concept popularized by economist and Nobel laureate Robert Shiller, suggests the S&P ‘s 10-year forecast annualized return is about 4.9 per cent, reflecting today’s stretched valuation. That’s below the yield offered on investment-grade corporate bonds. History shows there’s a close relationship between the market’s starting CAPE ratio and its subsequent 10-year return. This relationship likely motivated Warren Buffett to allow his cash pile to rise to $325 billion in the third quarter, representing 28 per cent of Berkshire Hathaway’s asset value.
Valuation Is Not a Timing Tool
While valuation is an important driver of long-term returns, it’s not a timing tool. Whether the market is cheap or expensive has little influence on next year’s return, for example. Cheap markets can remain cheap and expensive markets can remain expensive for years. Excluding the period between 2008 and 2022 when the Fed’s quantitative easing kept interest rates artificially low, an expensive market stayed consistently expensive relative to bonds between 1996 and 2002, and cheap relative to bonds between 2002 and 2008.
In December 1996, then-Fed Chairman Alan Greenspan was concerned about an expensive stock market and its impact on monetary policy. Worrying aloud, while trying to deflate what he thought was a stock market bubble, he rhetorically asked in a televised speech, “How do we know when irrational exuberance has unduly escalated asset values?” Greenspan was right: the market was expensive at the end of 1996. Yet the S&P 500 advanced another 140 per cent before peaking in mid-2000, nearly four years later.
Momentum Can Spot When a Market Starts to Slip
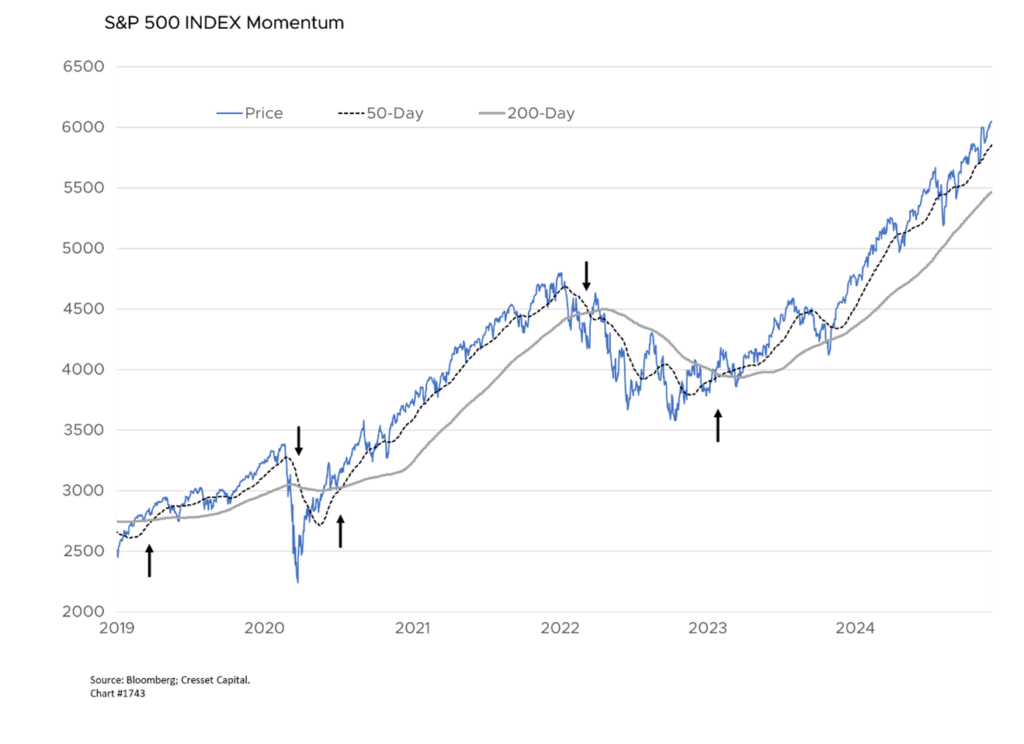
Momentum, a directional trend-following indicator reflecting near-term supply and demand, can help identify when an expensive market is losing ground. A simple measure like the relationship between the 50-day and the 200-day moving averages is a useful directional guide. Momentum is positive when the 50-day is higher than the 200-day, and momentum is negative when the 50-day falls below the 200-day. By itself, momentum has been a useful directional S&P 500 trading tool. The momentum indicator issued a sell signal in March 2022 and a subsequent buy signal in February 2023, helping avoid 11 per cent of 2022’s 18 per cent downturn, yet allowing investors to capitalize on the 2023-2024 rally.
Momentum Plus Valuation an Important Timing Tool
Combined with valuation, momentum is a valuable timing tool, particularly when an expensive market loses steam. Looking at valuation plus momentum back to 2000, the three-month return comparison is stunning. On average, the S&P 500 loses 2.8 per cent over the three months following an expensive market that loses momentum, underperforming every other valuation and momentum combination by as much as 5.4 per cent over all other three-month periods. Meanwhile, an expensive market exhibiting positive momentum has delivered strong three months results, on average.
Bottom Line:
Today’s valuation suggests that longer-term, tax-insensitive investors should tilt away from equities, or at least rebalance back to strategic targets. With the 10-year S&P expected return at around five per cent, there are better alternatives. The10-year, BBB corporate bond, for example, offers investors a five per cent annualized return if held to maturity – with meaningfully lower volatility. Shorter-term investors should monitor momentum. History has shown that an expensive market can remain expensive. It also suggests an expensive market that breaks down has been a valuable sell signal. Value investors are always right, but they’re often early.
LinkedIn
Print
About Cresset
Cresset is an independent, award-winning multi-family office and private investment firm with more than $65 billion in assets under management (as of 1/15/2025). Cresset serves the unique needs of entrepreneurs, CEO founders, wealth creators, executives, and partners, as well as high-net-worth and multi-generational families. Our goal is to deliver a new paradigm for wealth management, giving you time to pursue what matters to you most.
Market Update 12/11/24: When Valuation Says ‘Sell’ but Momentum Says ‘Buy’
By Jack Ablin, Chief Investment Officer. Subscribe for weekly market updates.
Key Observations:
How should investors approach a market in which valuation says “sell” but momentum says “buy”? Traditional valuation measures suggest the S&P 500 is currently more than 20 per cent overvalued, yet trend-following measures, like momentum, remain strong. Let’s break it down.
Thanks to a terrific two-year run, the S&P 500 has become a victim of its own success. US large caps are more than 60 per cent higher since the beginning of 2023, with earnings advancing a little more than 16 per cent in the interim, leaving the blue-chip index expensive from several perspectives.
Stocks 20%+ Overpriced, with 10-year Forecast Return Below BBB Bond Yield
Gauging stocks through the lens of bonds suggests the market is more than 20 per cent overpriced. The S&P 500’s earnings yield – the reciprocal of its price/earnings (P/E) ratio – is lower than that of an intermediate-maturity corporate bond, giving bonds the edge in the clamor for capital. The P/E multiple implied by the BBB corporate bond yield suggests the S&P 500 should trade at a multiple of 20x. The index currently trades at 25x next year’s estimated earnings.
Looking at it another way, the market’s cyclically adjusted price/earnings ratio (CAPE), a concept popularized by economist and Nobel laureate Robert Shiller, suggests the S&P ‘s 10-year forecast annualized return is about 4.9 per cent, reflecting today’s stretched valuation. That’s below the yield offered on investment-grade corporate bonds. History shows there’s a close relationship between the market’s starting CAPE ratio and its subsequent 10-year return. This relationship likely motivated Warren Buffett to allow his cash pile to rise to $325 billion in the third quarter, representing 28 per cent of Berkshire Hathaway’s asset value.
Valuation Is Not a Timing Tool
While valuation is an important driver of long-term returns, it’s not a timing tool. Whether the market is cheap or expensive has little influence on next year’s return, for example. Cheap markets can remain cheap and expensive markets can remain expensive for years. Excluding the period between 2008 and 2022 when the Fed’s quantitative easing kept interest rates artificially low, an expensive market stayed consistently expensive relative to bonds between 1996 and 2002, and cheap relative to bonds between 2002 and 2008.
In December 1996, then-Fed Chairman Alan Greenspan was concerned about an expensive stock market and its impact on monetary policy. Worrying aloud, while trying to deflate what he thought was a stock market bubble, he rhetorically asked in a televised speech, “How do we know when irrational exuberance has unduly escalated asset values?” Greenspan was right: the market was expensive at the end of 1996. Yet the S&P 500 advanced another 140 per cent before peaking in mid-2000, nearly four years later.
Momentum Can Spot When a Market Starts to Slip
Momentum, a directional trend-following indicator reflecting near-term supply and demand, can help identify when an expensive market is losing ground. A simple measure like the relationship between the 50-day and the 200-day moving averages is a useful directional guide. Momentum is positive when the 50-day is higher than the 200-day, and momentum is negative when the 50-day falls below the 200-day. By itself, momentum has been a useful directional S&P 500 trading tool. The momentum indicator issued a sell signal in March 2022 and a subsequent buy signal in February 2023, helping avoid 11 per cent of 2022’s 18 per cent downturn, yet allowing investors to capitalize on the 2023-2024 rally.
Momentum Plus Valuation an Important Timing Tool
Combined with valuation, momentum is a valuable timing tool, particularly when an expensive market loses steam. Looking at valuation plus momentum back to 2000, the three-month return comparison is stunning. On average, the S&P 500 loses 2.8 per cent over the three months following an expensive market that loses momentum, underperforming every other valuation and momentum combination by as much as 5.4 per cent over all other three-month periods. Meanwhile, an expensive market exhibiting positive momentum has delivered strong three months results, on average.
Bottom Line:
Today’s valuation suggests that longer-term, tax-insensitive investors should tilt away from equities, or at least rebalance back to strategic targets. With the 10-year S&P expected return at around five per cent, there are better alternatives. The10-year, BBB corporate bond, for example, offers investors a five per cent annualized return if held to maturity – with meaningfully lower volatility. Shorter-term investors should monitor momentum. History has shown that an expensive market can remain expensive. It also suggests an expensive market that breaks down has been a valuable sell signal. Value investors are always right, but they’re often early.
About Cresset
Cresset is an independent, award-winning multi-family office and private investment firm with more than $65 billion in assets under management (as of 1/15/2025). Cresset serves the unique needs of entrepreneurs, CEO founders, wealth creators, executives, and partners, as well as high-net-worth and multi-generational families. Our goal is to deliver a new paradigm for wealth management, giving you time to pursue what matters to you most.