Key Judgments
- Divergence between cap-weighted and equal-weighted S&P 500 Index widest since tech bubble.
- Despite similarities with 2000, the situation is different this time: AI companies generate sustainable profit and liquidity.
- Though a handful of mega-caps are overvalued, the average stock is not.
S&P 500 First Half Recap
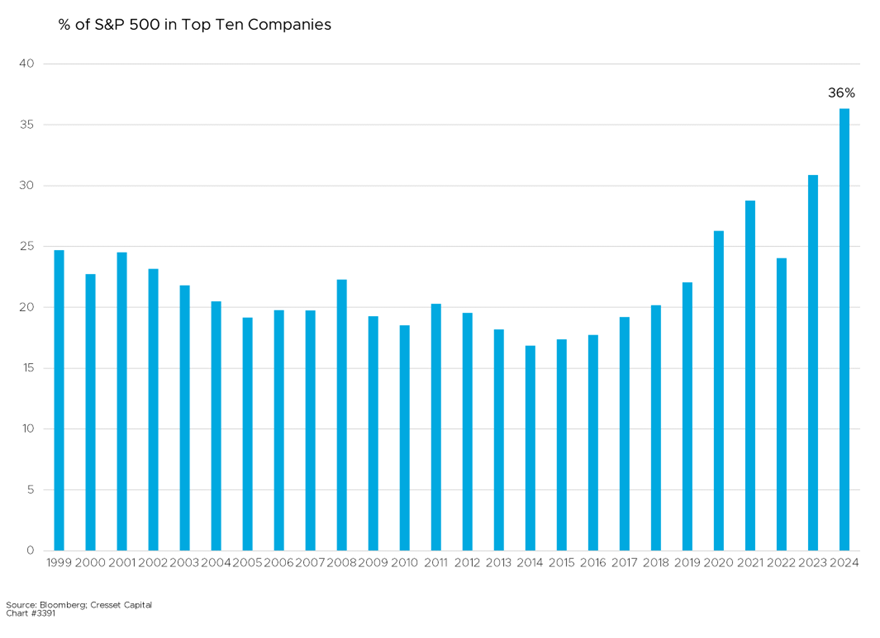
The S&P 500 was strong in the first half of 2024, gaining about 15% year-to-date and advancing more than four per cent in the second quarter. Like last year, market gains were fueled by a handful of mega-cap tech stocks, creating an unusually concentrated market. Just five stocks – Microsoft, Apple, Nvidia, Amazon and Meta – accounted for more than half of the Index’s total return. The top three stocks now make up nearly 21 per cent of the Index’s market value, while the top 10 stocks account for over 36 per cent. This concentration is the highest in the history of the S&P 500 Index and has created a significant performance divergence between these mega-cap tech leaders and the rest of the market.

Divergence Widest Since the Tech Bubble
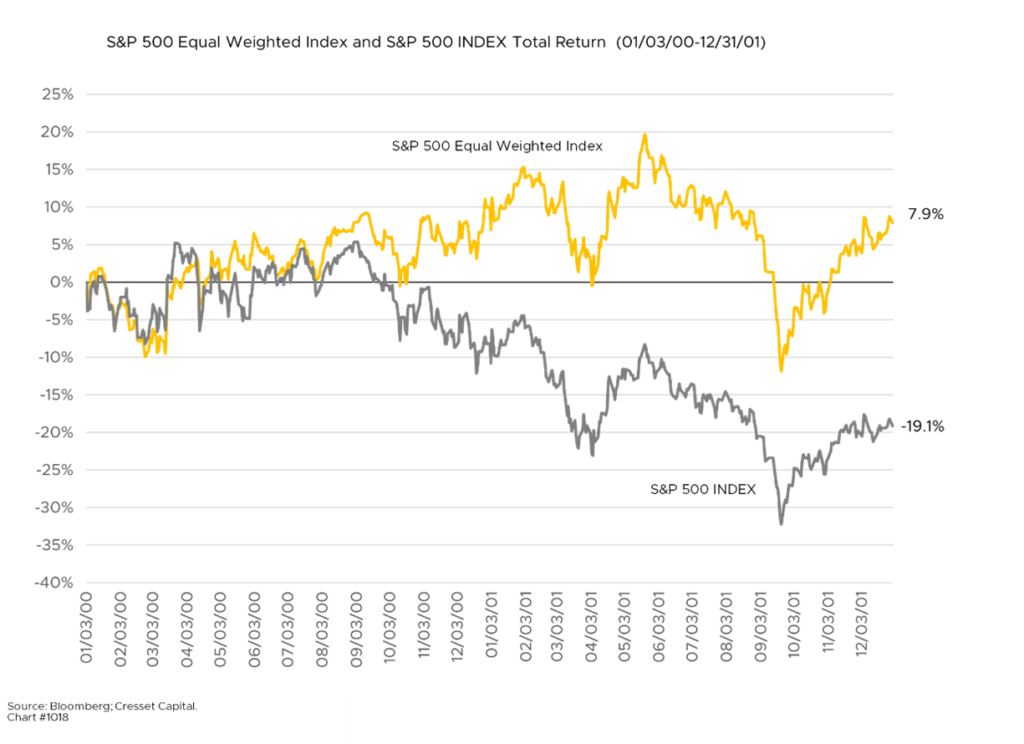
The S&P 500 continued its march higher in the second quarter, rising 4.28 per cent for the three months ended June 30. But we see signs of weakness under the surface, and divergence is growing. Six out of 11 S&P sectors lost value last quarter, while small and mid-cap stocks fell 4.27 per cent. The average stock in the S&P 500 was up about four per cent for the year, trailing the market by 10 percentage points. That’s the widest six-month divergence between the cap-weighted index and the average stock since the tech bubble in 2000, when the equal-weighted index trailed the S&P by 11 percentage points.

Narrow Rally Creates Challenges for Active Managers
This narrow rally has created challenges for active fund managers trying to beat the Index because they are structurally limited to looking like the S&P 500. Most managers are restricted by diversification requirements and other risk-management practices. Only 18.2 per cent of actively managed funds benchmarked to the S&P 500 outperformed it in the first half of 2024, down from 19.8 per cent for all of 2023, according to Morningstar. Moreover, among the 50 largest actively managed US large-cap mutual funds, representing nearly $1.7 trillion in assets, not one outpaced the blue-chip index over the first half of the year. Passively-managed index funds, on the other hand, are not subject to diversification limits.

Stock Size Matters Lately, Stock Yield Doesn’t
Size had been the most powerful ingredient of success this year. The average return among the largest 100 stocks in the S&P 500 Index outpaced the average return of the smallest 100 stocks by more than 20 percentage points year to date. And dividend yield has not been relevant to year-to-date performance. The lowest-yielding dividend stocks gained 19 per cent to date, while the highest yielders advanced little more than two per cent. Dividend yield, while attractive in a zero-rate environment, pales when the bond market suddenly offers a competitive income alternative to dividend stocks. A Fed rate cut – perhaps as early as September, the chance of which is currently pegged at 75 per cent – could provide the catalyst for broader equity participation.

The Average Stock Is Reasonably Valued
Markets tend to be victims of their own success, and persistent strong performance has pushed valuations to elevated levels. The S&P 500 P/E ratio is now over 21x forward earnings, its highest reading since late 2021, when interest rates were near zero. The top tech stocks are even more expensive, sporting an average P/E of 34x. The 10-year, BBB bond yield of 5.53 per cent, a useful equity market barometer, implies a “fair” forward P/E of about 18x, suggesting the market is about 15 per cent overvalued. However, underneath the surface, the forward P/E of the average stock is 17x, a figure more closely aligned with “fair” value. While we’re not anticipating a replay of the 2000 tech bust, it should be noted that between 2000 and 2001, while the S&P cap-weighted index lost 20 per cent of its value, the S&P 500 equal weighted index gained nearly eight per cent. Despite an environment in which the market is hinged to the resplendent trajectory of a handful of stocks, many of which are arguably expensive, the average stock is relatively insulated thanks to its more reasonable valuation.

We Aren’t in Another Tech Bubble
Even though today’s parallels to the tech bubble of the early 2000s are ominous, fortunately there are meaningful differences between then and now. This time around, the AI champions are making sustained profits while generating lavish liquidity, whereas most of the dot.com darlings did not. Therefore, expectations are high going into second-quarter earnings season. Analysts forecast between eight and nine per cent year-over-year earnings growth for S&P 500 companies, representing the strongest quarterly gain since early 2022. Analysts are estimating 14 per cent earnings growth in the tech sector, although they are penciling in 18 per cent earnings growth among communications names (Meta and Alphabet). We will be watching whether earnings growth broadens beyond the tech and communications sectors. Health care profits, fueled by overwhelming demand for semaglutide (GLP-1) weight-loss drugs manufactured by Novo Nordisk and Eli Lilly, are expected to have ballooned more than 20 per cent over the previous four quarters. We expect interest rate expenses and waning goods demand among households to weigh on the consumer sectors.


Bottom Line
While the S&P 500’s headline performance has been strong so far this year, the underlying dynamics reveal a complex and potentially fragile market environment. The extreme concentration in a handful of mega-cap tech stocks has driven returns but has also created distortions and challenges for both investors and fund managers. While the S&P 500 Index has made 36 new all-time highs so far this year, underneath the surface more than half of Index constituents – representing about a quarter of the Index’s market cap – are trading more than 20 per cent below their all-time highs. As we enter Q2 earnings season, there will be pressure on the market’s handful of top performers to deliver strong results to justify their elevated valuations. We believe the sustainability of market trends will require a broadening of participation as we enter the second half. A Fed rate cut perhaps as early as September, the likelihood of which is currently 75 per cent, could provide the catalyst for broader equity participation.

