

Key Judgments
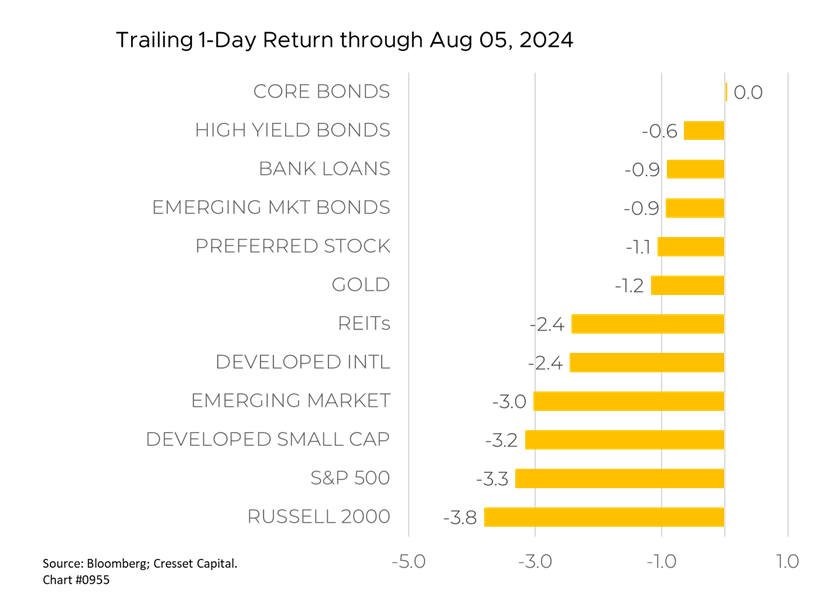
- Global market sell-off today led by Japan’s Topix and the S&P 500
- Weak US jobs report, slowing consumer spending, and fears of delayed Fed rate cuts are the catalysts
- This downturn appears to be a technical correction, with the S&P 500 so far down 6%
Global stock markets tumbled amid growing concerns about the US economy and a rapid unwinding of market positions. The sell-off was particularly severe in Japan, where the Topix Index suffered its worst day since 1987. US and European markets also dropped sharply, with the S&P 500 down over two per cent and the NASDAQ falling nearly three per cent, as of this writing. The S&P 500 has fallen about six per cent since last Wednesday.
Investors worry that the Fed waited too long to cut rates
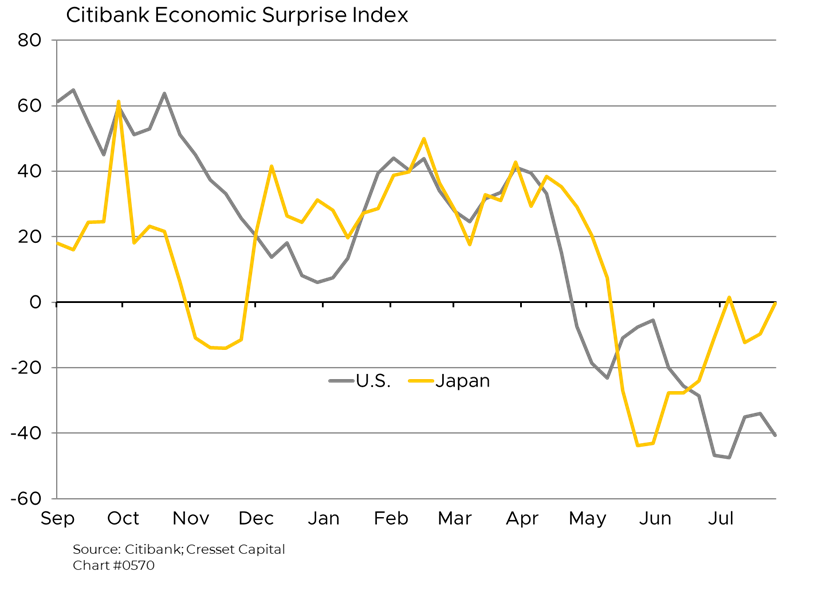
The sell-off was triggered by several factors, including a weaker-than-expected US jobs report on Friday that showed slower hiring and rising unemployment, fueling recession fears. Concerns were compounded by recent signs of weakening consumer spending in the US, as evidenced by last week’s earnings reports from companies like McDonald’s. Investors are now concerned that the Federal Reserve may have waited too long to begin cutting interest rates and are now pricing in a much more aggressive pace of rate cuts, with some even speculating about the possibility of an emergency rate cut before the next scheduled meeting in September. Concern is growing that the Fed might need to act quickly to prevent a recession-inducing feedback loop between markets and the real economy. It should be noted that US economic data began falling short of expectations as far back as May, according to the Citibank Economic Surprise Index.
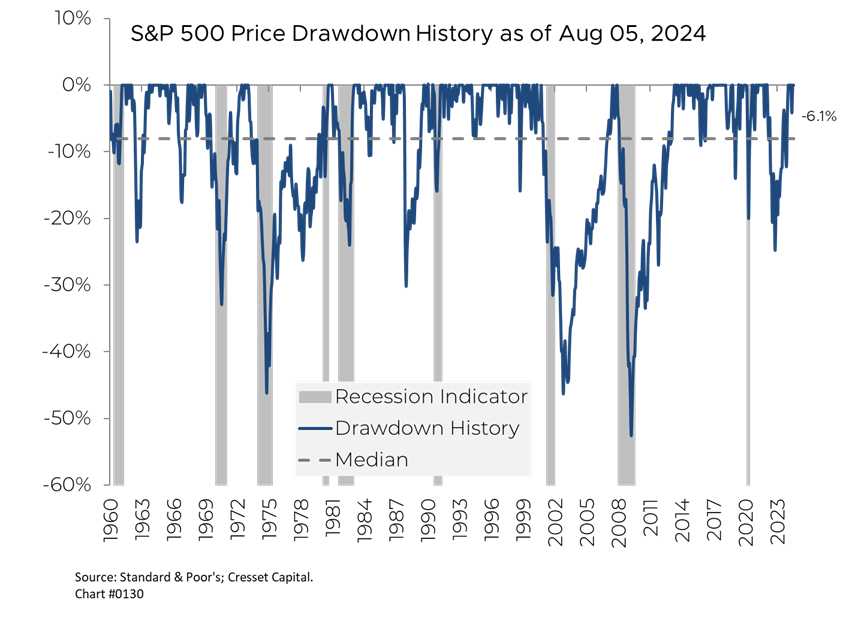
We’re likely seeing a technical correction, the least severe type of pullback
History has shown there are three types of market pullbacks:
Technical correction. Occurs when valuations and emotions get out of whack, often when rallies are fueled by optimism. These pullbacks tend to be relatively short lived and “V-shaped.” Technical corrections typically retreat between 10% and 15%.
Cyclical pullback. Sparked by recessions and tend to be longer lived, lasting 12 to 18 months. Recession-related pullbacks often draw down about 20 per cent, representing a typical bear market.
Systemic pullback. The most severe of the three (think of the global financial crisis), and exacerbated when investors start to worry about the viability of the financial system. Equity losses in a systemic pullback can exceed 40 per cent.
While it is still early, we believe the current downturn is a technical correction. As of this afternoon, the S&P 500 has drawn down a little more than six per cent from its recent peak, about halfway through the likely damage.
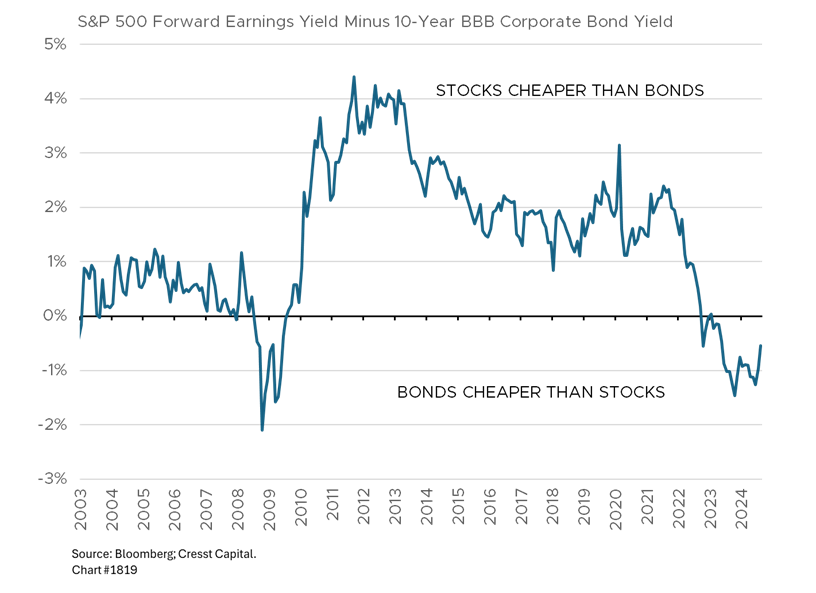
We highlight that there are two ways equities valuations can “correct.” First, with lower prices – and we’ve certainly seen that over the last three trading days. The second way equity valuations come back in line is with lower bond yields and that’s happening as well. The 10-year Treasury yield has plunged 0.7 per cent since its recent peak, taking some of the pressure off equity prices to fall to meet fair value.
Bottom Line:
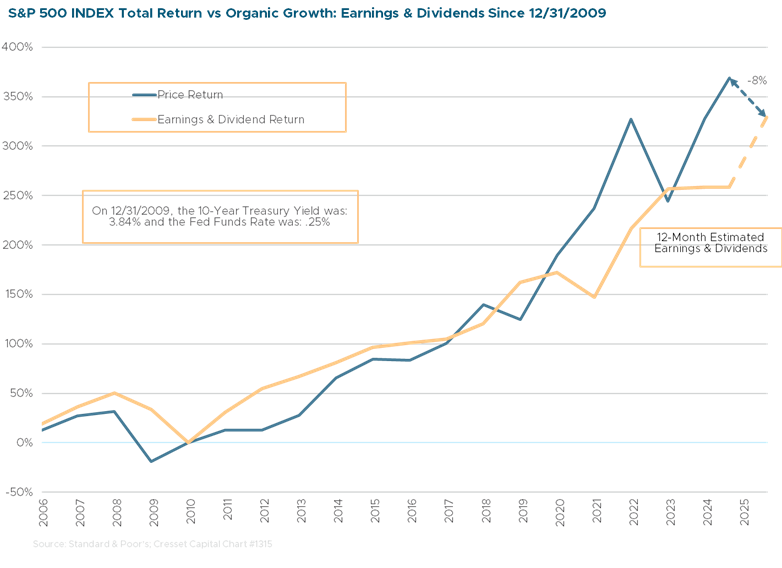
The coming days and weeks will be crucial in determining whether this market sell-off develops into a more prolonged downturn or if it proves to be a short-term correction. Much will depend on upcoming economic data and the response of central banks, particularly the Federal Reserve. Unlike previous downturns, this time the Fed has abundant dry powder to address an equity market downtrend before it could impair confidence and growth. That said, the S&P 500 remains slightly overvalued based on cumulative earnings and dividend growth since 2009, the last time the 10-year Treasury was at current levels. While we’re not recommending an asset allocation shift, astute investors always use downturns to harvest losses when possible.
Feel free to reach out if we can be of assistance.