

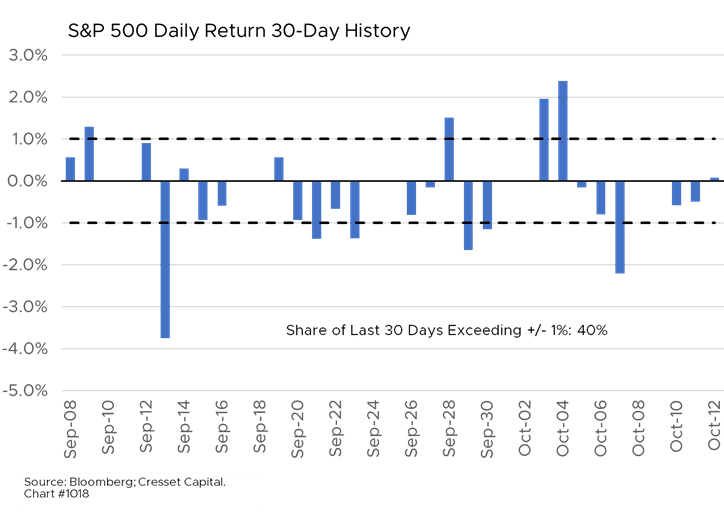
10.12.2022 Investors are nervous about Q3 earnings season, as evidenced by recent market volatility. Over the last month, the S&P’s daily return volatility exceeded one per cent nearly half the time. The S&P 500 is on track to post its worst annual showing since the financial crisis. Over the past month, companies including FedEx, Nike and Carnival offered disappointing results or guidance and were summarily punished, according to The Wall Street Journal. Analysts are anticipating 2.5 per cent Q3/22 year-over-year profit growth. Without the help of the energy sector, which is expected to deliver 123 per cent profit gains, S&P earnings would be nearly 4 per cent lower than they were in Q3/21. This season, company managements have a panoply of headwinds to blame when offering up disappointing results.
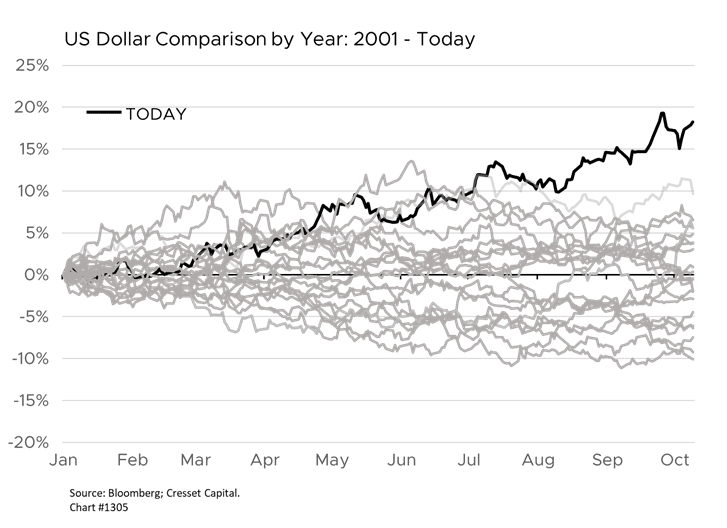
First: the dollar. Thanks to aggressive Federal Reserve action, the US dollar is on pace to surge to its strongest level in decades, gaining nearly 20 per cent this year. Operating in a currency that’s 20 per cent more expensive than those of your foreign competitors makes US companies’ goods 20 per cent more expensive globally. Moreover, any repatriated foreign revenue would be diminished by 20 per cent when translated back into US dollars, hurting both sales growth and profit growth. It is estimated that S&P 500 companies derive about 32 per cent of their revenue overseas. That’s down from 36 per cent at its 2012 peak, according to Bloomberg.
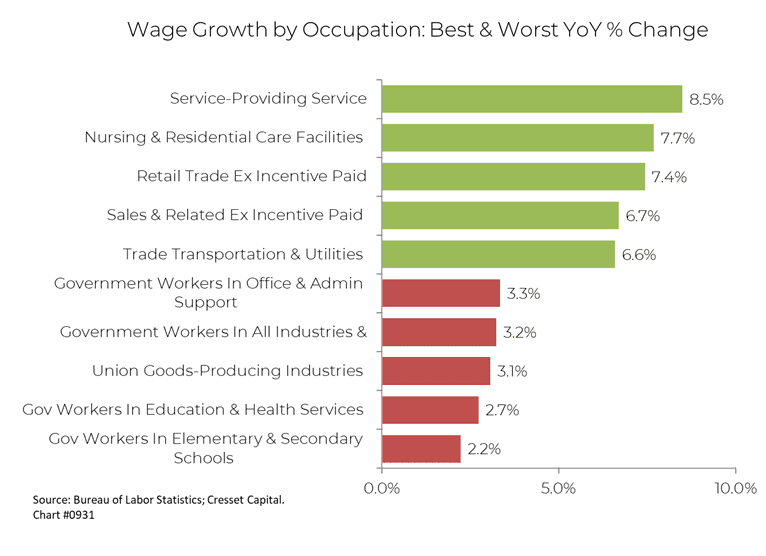
Second: inflation. While a strong dollar helps stem import prices, input costs including wages are nonetheless on the rise. Wages among service workers have expanded 8.5 per cent over the year ended in June, according to the Bureau of Labor Statistics. That means restaurants, travel and other service providers are feeling the pinch. Government wage growth, up around 3 per cent, has trailed wage gains in the private sector – cold comfort for corporate profitability, however.
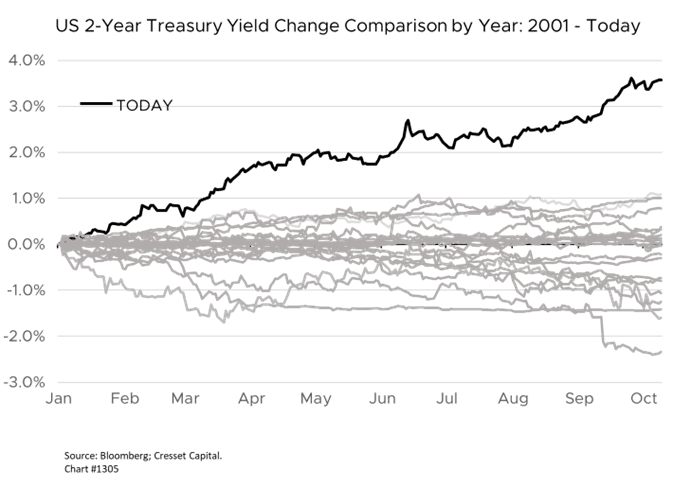
Third: higher borrowing costs due to higher interest rates. This year we have witnessed the steepest rise in interest rates since 1994. The two-year Treasury yield spiked to 4.28 per cent from 0.77 per cent since the beginning of the year. At 3.9 per cent, the 10-year Treasury yield has more than doubled. Higher rates propel borrowing costs skyward. US corporations have issued $1.1 trillion of debt this year through August, according to the Federal Reserve. That’s down from $1.5 trillion year-to-date last year, but we estimate $1.1 trillion at a 2 per cent incremental rate increase is costing US companies roughly $22 billion in annual debt service between 2021 and 2022.
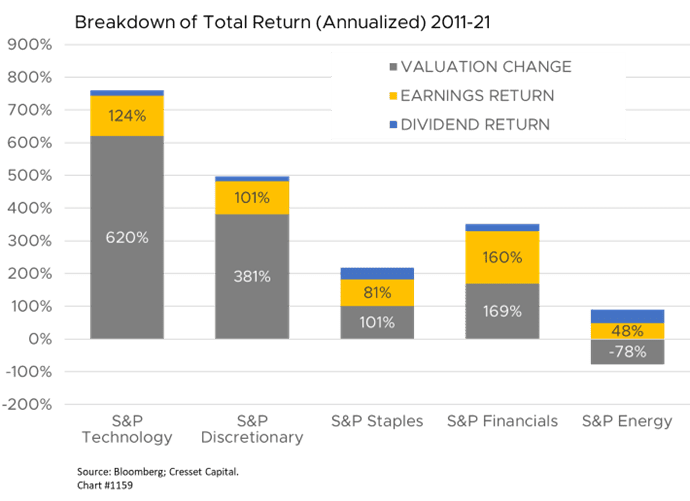
The technology sector exemplifies the boom-and-bust nature of monetary policy. Tech investors are making profitability their priority following a decade in which money-losing technology stocks outpaced their profitable counterparts. Easy money and interest rates held below the inflation rate fueled the speculative surge. Tight money and an aggressive Fed are doing the opposite this year. Unprofitable tech companies have lost nearly 60 per cent of their value so far this year, according to data compiled by Goldman Sachs. Hanging onto talent is another risk facing unprofitable tech firms, since many of them offered stock-based compensation packages that tend to work on the way up, but backfire when share values are cut in half. Between 2011 and 2021, the technology sector delivered a cumulative 760 per cent return to investors, or about 24 per cent annualized. Of that, 620 percentage points was attributable to valuation expansion, leaving 140 per cent, or about 9.1 per cent annualized, attributable to earnings growth and dividend yield. As we have pointed out repeatedly in our research, it’s unlikely investors will have the luxury of valuation expansion over the next 10 years.
The economic environment is murky, as investors and company management teams monitor the Federal Reserve’s inflation battle. We worry that the Fed could overdo it, thanks to the lagged impact of monetary policy on the economy and credit markets. Ratcheting up interest rates is like standing in a shower stall where the faucets are on the wall opposite the shower head, creating a lagged effect between action (adjusting the faucet) and impact (sensing the temperature of the water flowing from the shower head). In its effort to tighten financial conditions, the Fed is opening the hot water valve at the fastest pace in decades. Based on my experience in poorly designed showers, the odds are the economy gets scalded, forcing the Fed to quickly reverse course.