
01.04.2023 Last year was all about inflation and its knock-on effects. The Fed’s aggressive rate hikes ripped the Band-Aid off and market returns stung investors. The worst performance for bonds in living memory and the worst performance for equities since the financial crisis are now in the rear-view mirror. Cresset will be tracking four themes as we start the New Year: endemic inflation; a mid-year growth slowdown; the unlikelihood of a soft landing; and the rollover of the US dollar.
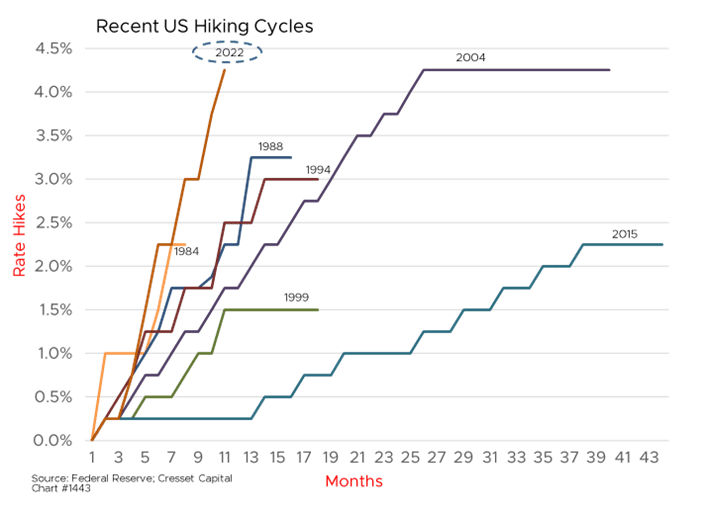
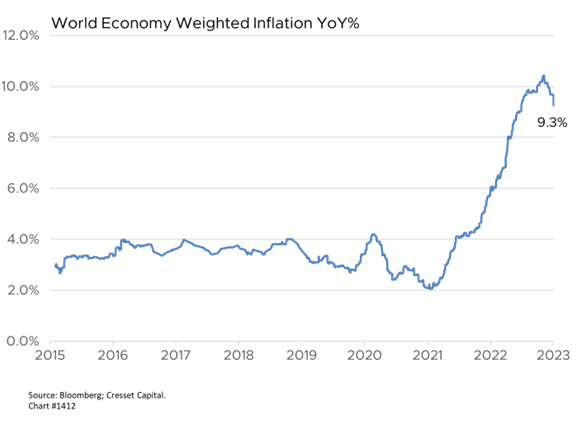
Thanks to governments’ efforts to prop up pandemic-stricken economies, 40 years of secular disinflation was reversed. Here at home, the Trump and Biden governments spent $7+ trillion to cushion the blow for unemployed workers and their beleaguered employers. That was enough to push inflation to over nine per cent last June, its highest reading since November 1981. That backdrop set the stage for the most aggressive Fed in recent memory. The Federal Open Market Committee hiked its target rate from zero to 4.25 per cent over the course of 10 months.
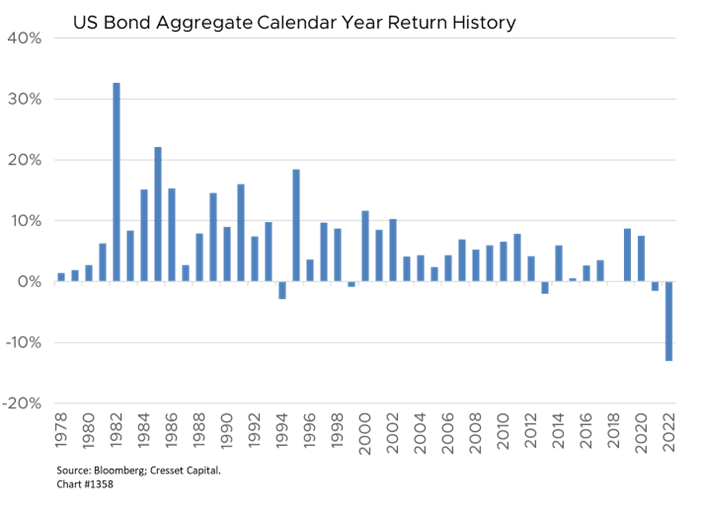
The Fed ripped the bandage off last year and market returns stung investors. Intermediate-term Treasury rates, a universal valuation metric, spiked between two and four percentage points in 2022, undermining all risk assets. The investment-grade bond market cascaded 13 per cent, its worst calendar year showing in modern history.
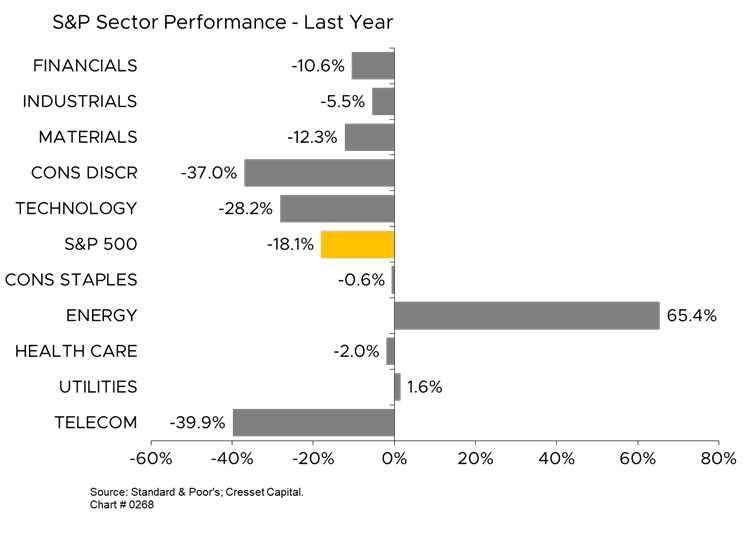
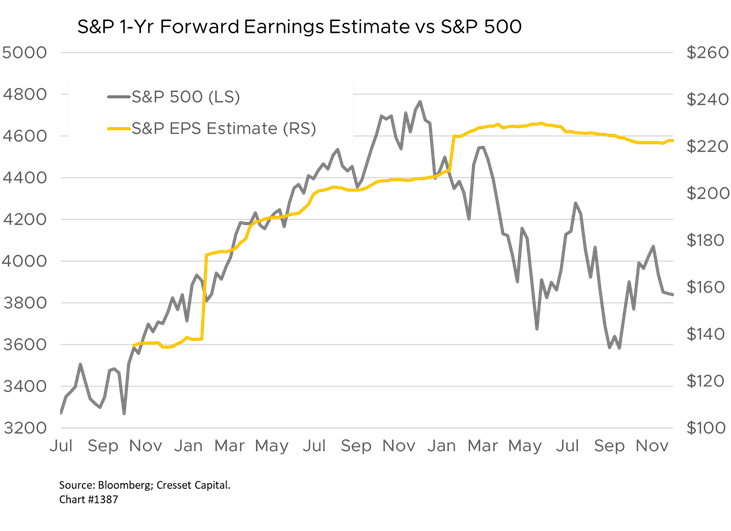
Nor were equities spared. The S&P 500 slid 18 per cent for the year, its worst showing since the 2008 selloff induced by the financial crisis. The market multiple, or P/E ratio, shrank from 23x to 17x forward earnings expectations – entirely explained by the 2.3 percentage point rise in the 10-year note. Ten of the Index’s 11 sector groups lost ground while energy, fueled by a spike in prices, soared. Growth-oriented sectors, like consumer discretionary, telecom and technology, lost between 28 and 40 percent of their value.
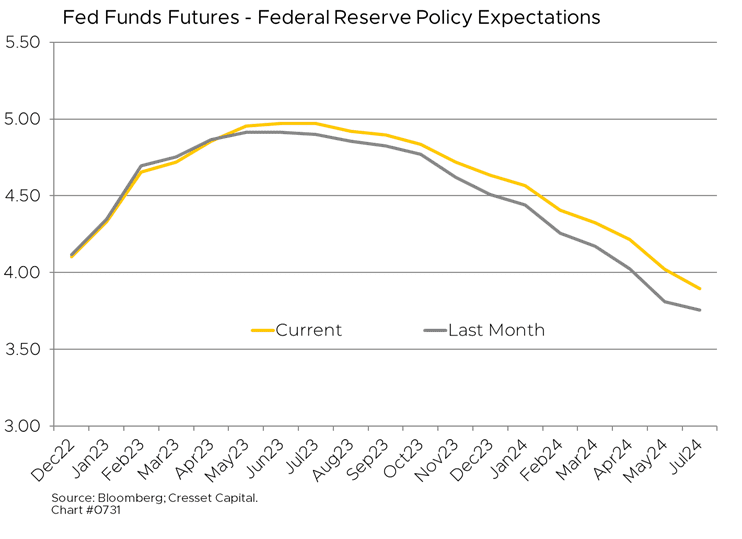
Inflation peaked in June at 9.1 per cent and has trended lower at a frustratingly slow pace and is expected to close out 2022 below 7%. Meanwhile, Fed watchers anticipate the overnight rate to reach five per cent by mid-year 2023 before retreating.
2023 Outlook
We’re tracking four themes as we embark on the new year.
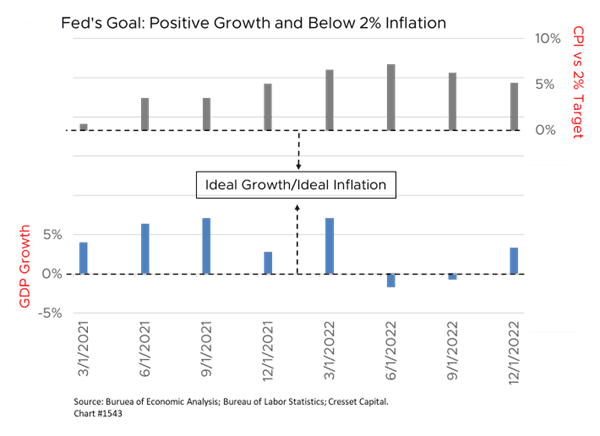
Endemic inflation: We expect inflation pressure to remain stubbornly high through 2023. Getting US inflation toward 3.5 per cent should be straightforward, but forcing it toward 2 per cent will be difficult. When faced with economic deterioration, we expect global central banks to pivot and accept higher-than-target inflation. Current energy and wage trends are more consistent with inflation about 2 per cent. We believe 3-4 per cent inflation will be tolerated for a period.
Mid-year growth slowdown: The cumulative effect of the Fed’s aggressive hiking cycle has yet to filter through the economy in a meaningful way. We expect economic data to continue to soften into 2023 and for unemployment to gradually creep upward. We anticipate a mild recession mid-year with S&P profit growth falling 10 per cent.
“Soft Landing” Scenario Unlikely: The Federal Reserve states it is not trying to put the country into a recession but rather is raising rates to a restrictive level in order to bring inflation down to target. Soft landings such as the one described above are evanescent. In reality, the cumulative tightening of monetary policy we have seen will likely skew the growth picture negative while inflation remains higher than policymakers would like through the end of 2023.
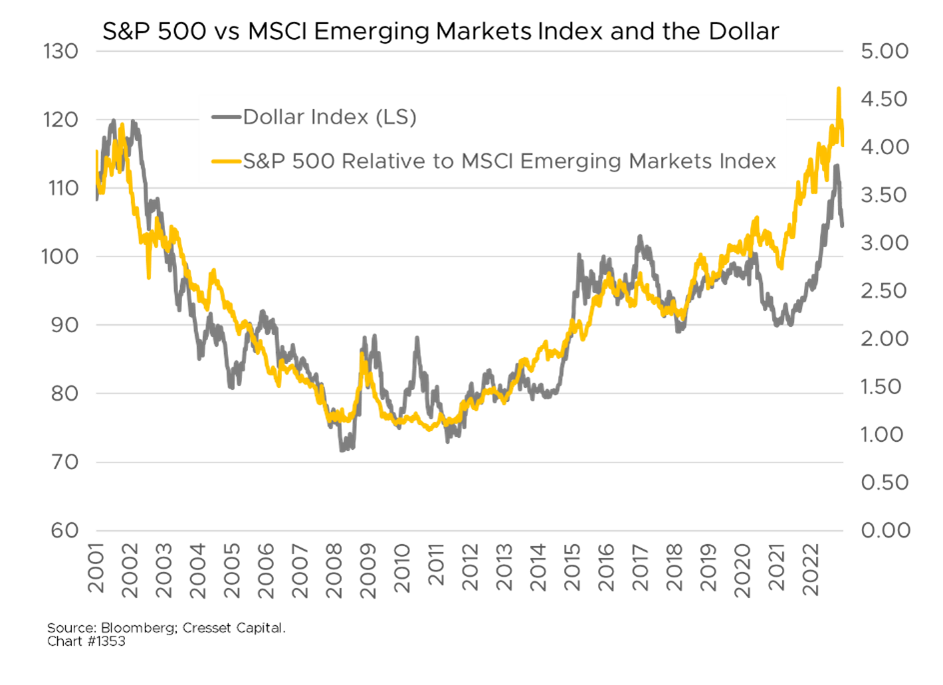
Dollar rolling over: The US dollar has had a particularly strong year on the back of Fed hikes and relative US economic strength. We expect the dollar to fall from here and open an opportunity to move back into risk assets, particularly international equities. The dollar is close to breaking down, leading the way to multi-year dollar weakening.
We look forward to publishing our 2023 outlook next week. In the meantime, please do not hesitate to reach out to Cresset if we can be of assistance as you navigate 2023.
Happy New Year!