

09/09/2021: Liquidity, the abundance of money to borrow spend and invest, is the lifeblood of risk taking. Expressed in anatomical terms, interest rates and the Federal Reserve represent the circulatory system of the financial markets. When money is abundant and interest rates are low, risk-taking is rewarded as consumers borrow and spend, and businesses borrow and invest. With interest rates near all-time lows and the Federal Reserve’s bond-buying program in high gear, to describe current liquidity conditions as abundant is an understatement. Wall Street and Main Street are utterly awash in green ink, which begs the question: Where do we go from here?
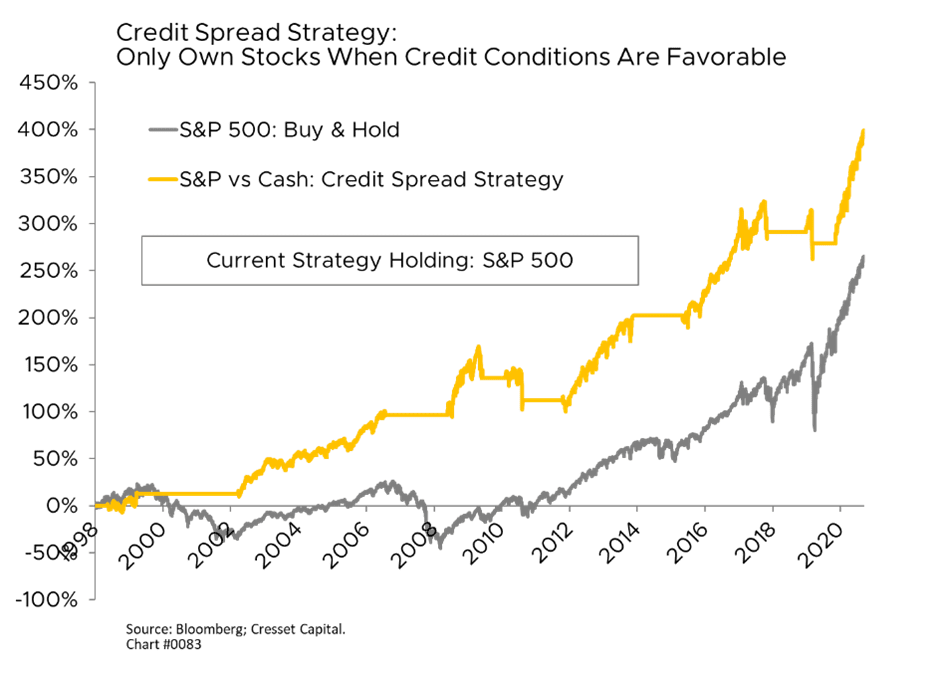
History has shown that changes in liquidity tend to lead market environments by up to four quarters. Even though the brunt of the financial crisis was felt in Q4/08, credit conditions began tightening in Q4/07. Cresset conducted a study that compared holding the S&P 500 only during favorable credit conditions (as defined by credit falling 10 per cent below its 200-day moving average and holding until it crosses 10 per cent above its 200-day moving average, versus buying and holding the S&P 500. The results, though not adjusted for capital gains taxes, are compelling. Over the 23-year period, credit trading outpaced holding the S&P 500 by 131 percentage points. That’s why monitoring liquidity is both prudent and prescient.
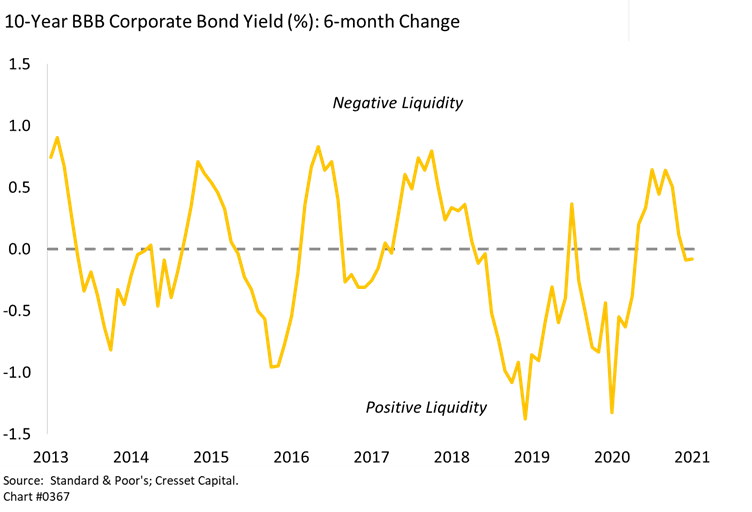
We use several indicators to measure liquidity. First are nominal borrowing costs. Have borrowing costs for companies and households increased or decreased over the last six months? Corporate borrowing costs (the combination of Treasury yields and credit risk premiums) over the last six months have been flat when comparing the 10-year, BBB borrowing rate today to where it was in March. Since last March, Treasury yields have fallen slightly while yield premiums have risen incrementally. On the household side, 30-year mortgage rates are about 0.2 per cent lower than they were six months ago, suggesting positive liquidity.
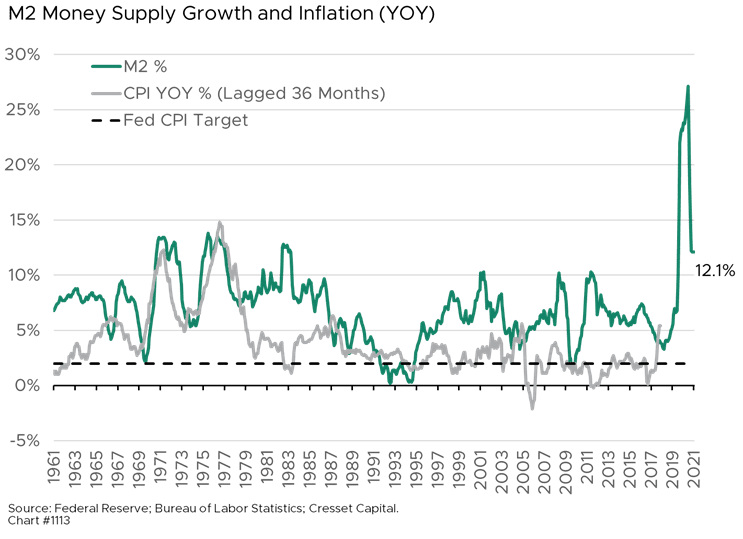
Changes in money supply growth is another factor we track to gauge the direction of liquidity. Interest rates represent the price of money, so a greater supply of money should equate to lower interest rates – and historically, that’s been the case. Think of money supply growth as the rate at which a train’s fireman is shoveling coal into a steam locomotive. Steady money supply growth is required to fuel a naturally growing economy. Yet too much money supply could overheat growth and, with constrained capacity, could push prices higher, while too little money supply could choke off growth. Historically, money supply and inflation are related. However, since 2000, their relationship has become less predictable, reducing their reliability as a guide for monetary policy. Watching money supply trends, however, offers us an early indication of economic tailwinds or headwinds. Money supply growth (as measured by M2) has been remarkably high, as monetary policy makers addressed the unprecedented COVID-related economic pullback. Recent indicators suggest that the extraordinary monetary expansion is subsiding, although at 12.1 per cent year-over-year growth, the policy remains extremely accommodative.
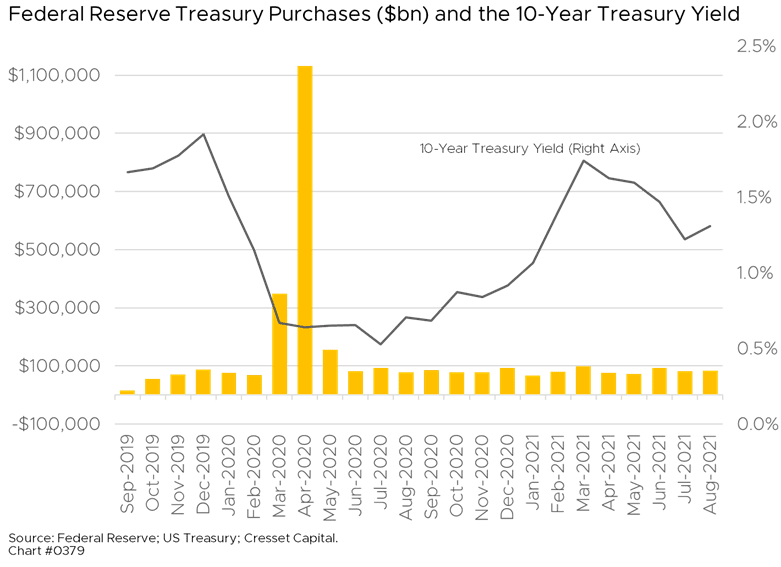
Quantitative easing, the Federal Reserve’s monthly bond purchase program, is another avenue of liquidity. Between March and April 2020, the Fed purchased about $1.5 trillion worth of Treasuries to boost liquidity and combat the contractionary effects of the pandemic. Since then, Powell & Company have been monthly buyers of $80 billion of Treasuries and $40 billion of mortgages. Last month, however, Chairman Powell braced the market for a gradual reduction in bond purchases beginning sometime this year, arguing that tapering isn’t tightening. The Fed has no plans to raise its benchmark overnight rate until sometime in 2023. That said, taking its foot off the accelerator isn’t necessarily the same thing as tapping the brakes. We do, however, expect the Fed’s tapering program to reduce liquidity later this year.
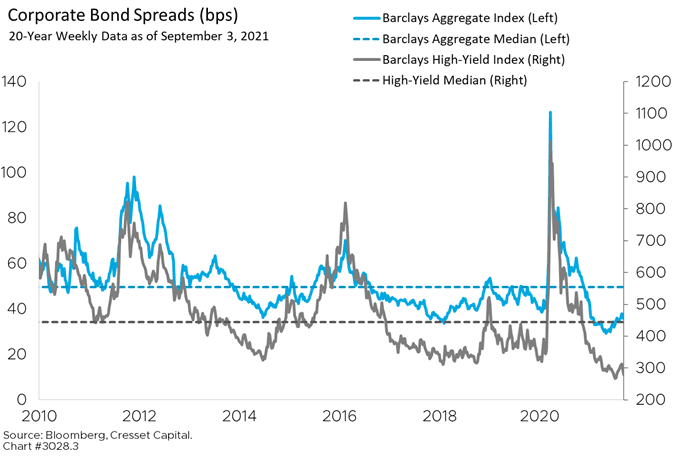
The last aspect of liquidity is credit conditions. How willing are lenders to extend credit to lower-quality borrowers, and how do current credit conditions compare to recent credit conditions? The best way to gauge credit is to compare investment-grade bond yields to similar maturity Treasury yields to determine changes in the yield premium, or spread. Interestingly, credit conditions have tightened incrementally for investment-grade borrowers as spreads have widened. Meanwhile, yield premiums lenders require to extend loans to below-investment-grade borrowers remain extremely narrow by historical standards. Spreads for both investment-grade and high-yield credits remain well below their historical median levels, suggesting robust liquidity.
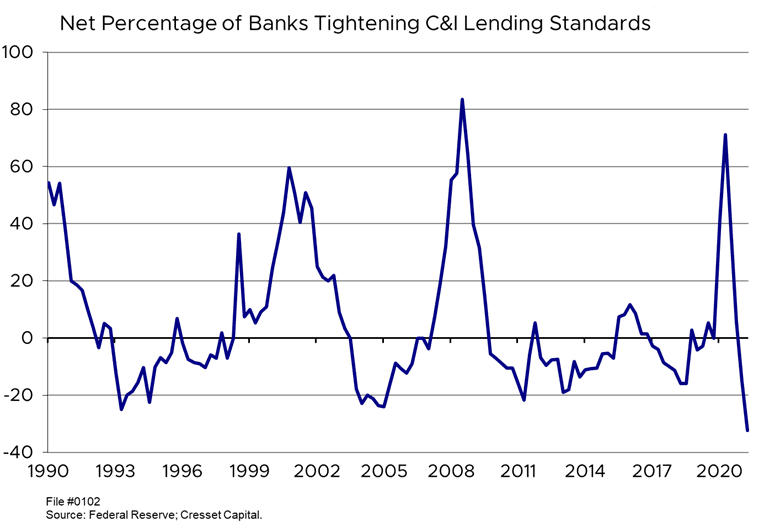
Meanwhile, lending standards remain easy, reflective of today’s robust liquidity environment. According to the Fed’s most recent Senior Loan Officer Opinion Survey, the share of banks easing their lending standards for commercial and industrial loans exceeded those tightening their standards by more than 30 per cent. That represents the easiest credit environment, directionally, in the survey’s history.
Bottom Line: Liquidity levels are high, and from several perspectives are near all-time highs. Lenders and other liquidity providers take their cues from the Federal Reserve, and Chairman Powell has signaled the Fed’s desire to reduce bond buying, although the Fed’s rate-hiking program appears to be a long way off. In the near term, we believe current liquidity levels justify continued risk taking. We will be on the lookout for factors that represent tighter liquidity. We believe these could start to emerge a quarter or two from now.