

02.22.2023 Economic data plots from the last few years look like electrocardiographs. The pandemic-induced lockdowns of 2020 forced activity to plunge while the 2021-22 recovery, by comparison, brought skyrocketing growth. Thanks to the lingering stimulus, employment is tight, spending is strong and prices remain stubbornly high. It may take another year or two, once the COVID fog lifts, for growth and interest rates to settle back toward their longer-term trend.
While the post-pandemic economy has witnessed several shifts in office work and living arrangements, growth will eventually glide toward its potential. This raises the question of what the “normal” 10-year Treasury rate should be in the 2020s. The 10-year Treasury is the benchmark rate of the bond market, but it also helps determine equity market earnings multiples as well as the cap rate for real estate valuations.
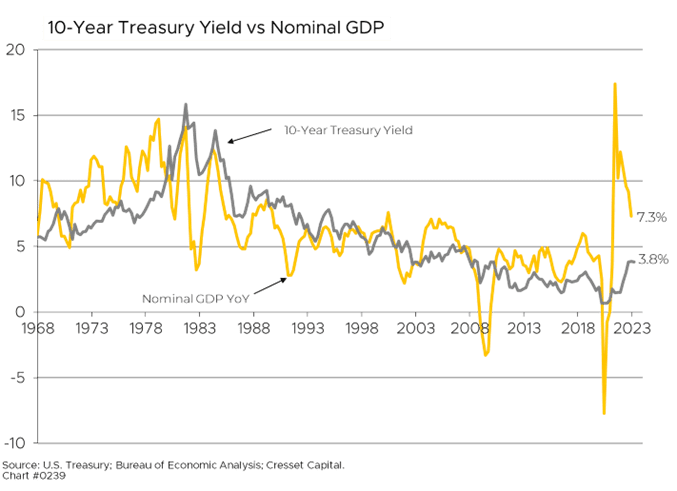
Historically, the 10-year Treasury yield tracks nominal GDP (real economic growth plus inflation). The period between 1983 and 2007 was a good proxy for the relationship between nominal GDP and the benchmark Treasury yield. Prior to 1983, stronger-than-expected inflation restrained the Treasury yield, while the post-financial-crisis Fed, with quantitative easing, held yields artificially below fair value until the beginning of 2022. We expect those rates to converge once the current economic heart palpitations are fully behind us.
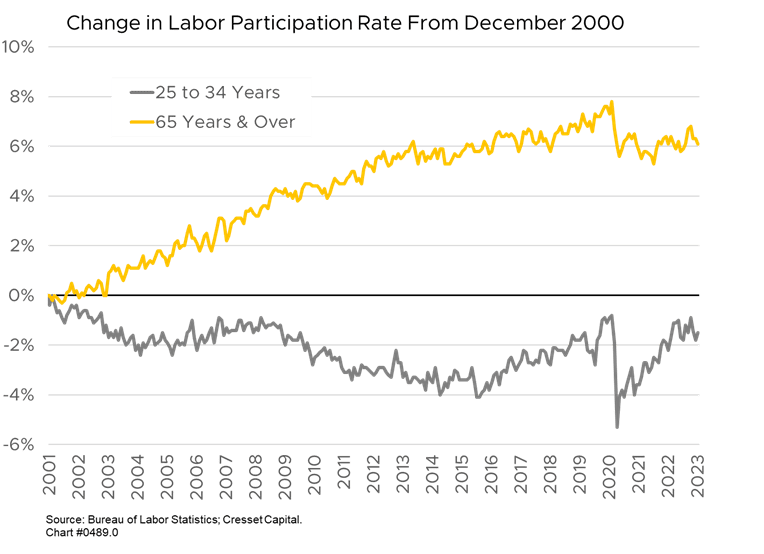
Real economic growth, or potential output, is the growth of the labor force multiplied by increased productivity – in other words, how much more output per hour we can expect. Labor force growth is largely demographic, anticipating the growth in the number of Americans between the ages of 18 and 65. However, older Americans are staying in the workforce longer while the share of younger Americans in the workforce is slipping. The percentage of Americans over 65 engaged in the workforce – 19.1 per cent – is six percentage points higher than it was in 2000. Meanwhile, 83.1 per cent of Americans between the ages of 25 and 35 are working, a proportion that has drifted 1.5 percentage points lower over the last 22 years. That’s remarkable given today’s tight labor market. At 3.4 per cent, today’s unemployment rate is its lowest level since 1968.
The Bureau of Labor Statistics (BLS), the part of the Labor Department which tracks and projects labor data, projects slower job growth over the coming decade as younger Americans are less likely to join the labor market. The BLS expects the overall labor participation rate to drop to 60.1 per cent by 2031, down from 61.7 per cent last year, even though the share of older Americans holding jobs will increase. Overall, the Labor Department projects the labor force will expand by 8.3 million between 2021 and 2031, according to The Wall Street Journal, with total employment reaching 166.5 million. That translates to annualized growth of 0.5 per cent, about half the rate achieved over the 10 years ended in 2021. The Department attributes this to lower fertility rates and a slowdown in immigration. Projecting the combination of demographics, immigration and participation is an art. The BLS did a reasonable job of projecting labor force growth over the previous decade, with their misses within a half percentage point.
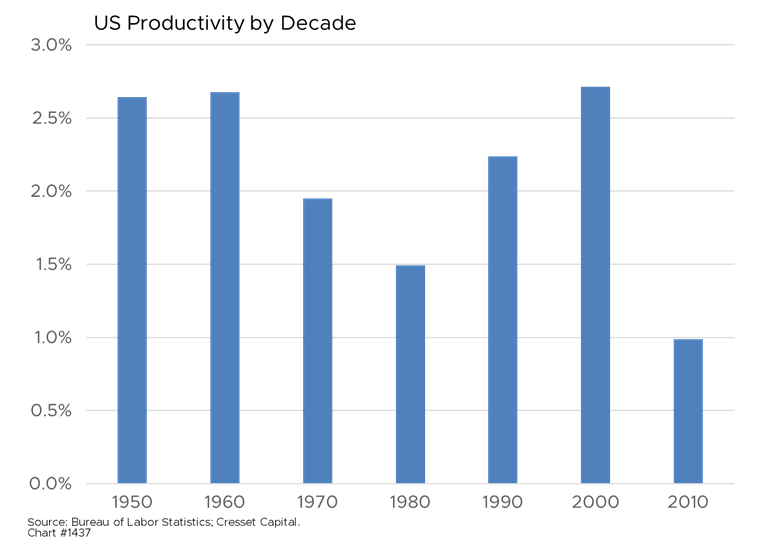
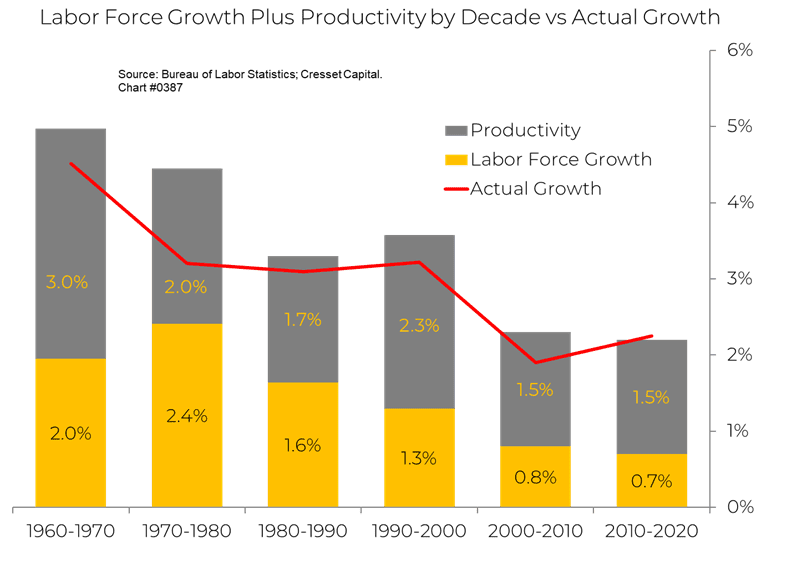
Predicting productivity is the hard part. Getting to the right number depends on projecting the correct proportions of innovation, capital formation and job mix, since productivity gains are harder to achieve in service jobs. There simply isn’t enough Mercurochrome for any barber who attempts to triple their number of haircuts per hour. Since the 1950s, the annual productivity rate has bounced between 1 per cent to just over 2.5 per cent, with the 1990s boosted by the personal computer landing on corporate desktops and the 2000s by consumers pointing and clicking on the World Wide Web. Productivity in the 2010s, however, was disappointing, dented by the global financial crisis. Using a combination of capital investment, innovation and a greater share of service jobs, we expect productivity to track around 1 per cent annually between 2020 and 2030.
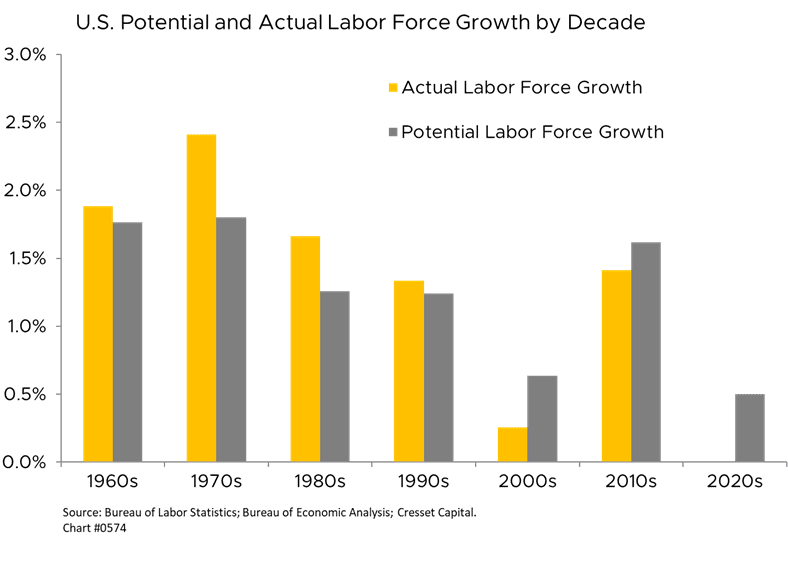
Adding 0.5 per cent labor force growth to 1 per cent productivity growth implies a potential GDP growth rate of 1.5 per cent over the decade of the 2020s. That’s substantially lower than previous decades, particularly the 1970s, when Baby Boomers entered the workforce. Labor force growth plus productivity has done a good job of gauging real GDP growth, particularly in more recent decades.
Adding an annualized inflation expectation to our real GDP estimate delivers annualized nominal GDP, a good proxy for the 10-year Treasury rate. Using the bond market as a guide, the five-year-forward five-year inflation rate is expected to be 2.6 per cent, substantially below our current bout, but above the Fed’s 2 per cent target rate. Adding our 2.6 per cent inflation estimate to our 1.5 per cent annual growth forecast implies a 4.1 per cent annualized nominal GDP growth rate and 4.1 per cent 10-year Treasury yield. The benchmark Treasury currently yields 3.8 per cent, slightly below its projected longer-term trend rate. It also means that the equity market multiple, which corresponds to the 10-year BBB corporate bond yield, will need to contract incrementally as the 10-year note drifts toward equilibrium. The good news: we’re not too far away from that equilibrium Treasury rate. Given current volatility, we could get there within a week.