

Key Observations
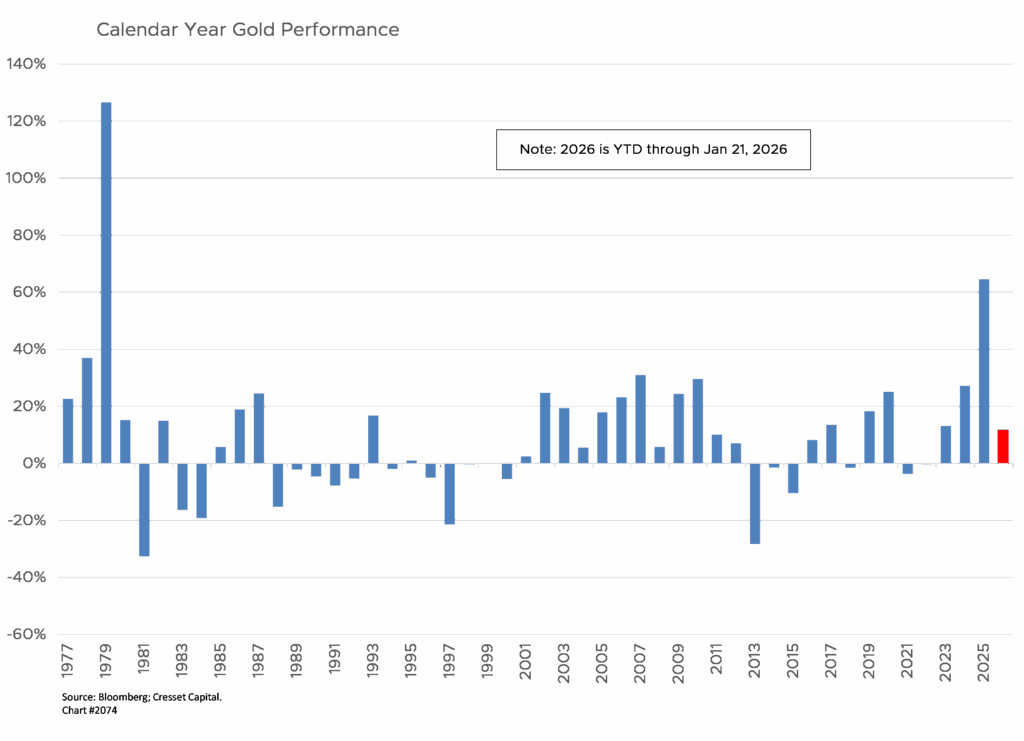
- Gold has reached record highs above $5,000 per ounce, marking its strongest calendar-year performance since 1979.
- Traditional valuation frameworks suggest gold is historically expensive relative to inflation and the U.S. dollar.
- Gold’s recent gains imply future inflation levels that appear unlikely based on current economic conditions.
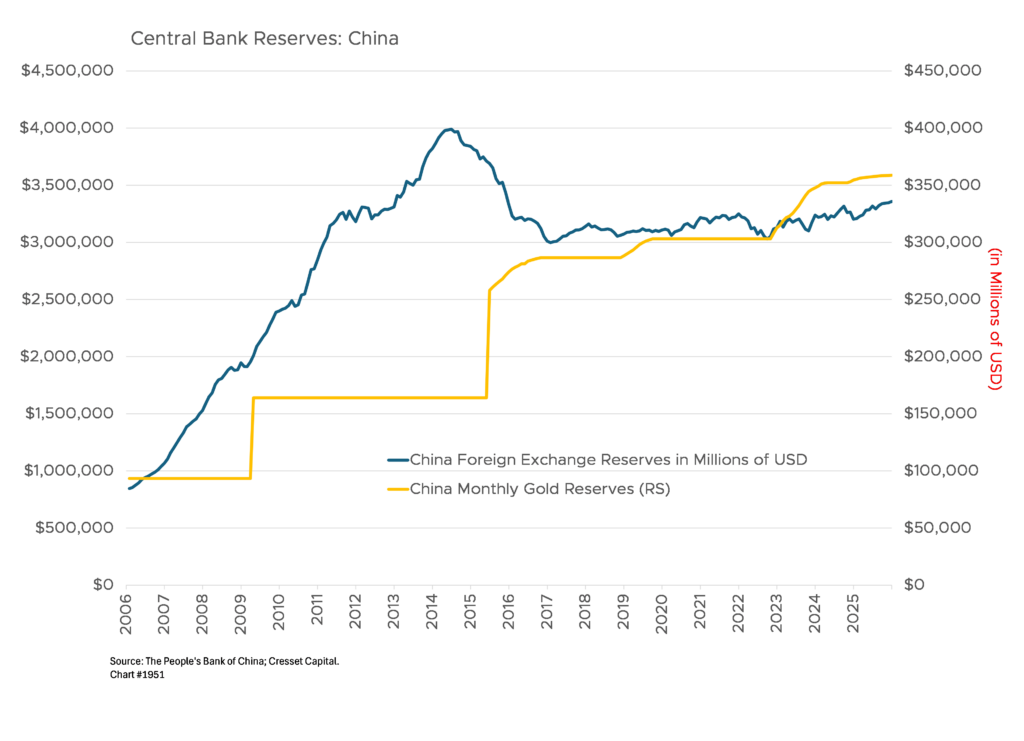
- Central bank buying, particularly from China and India, has been a major structural driver of demand.
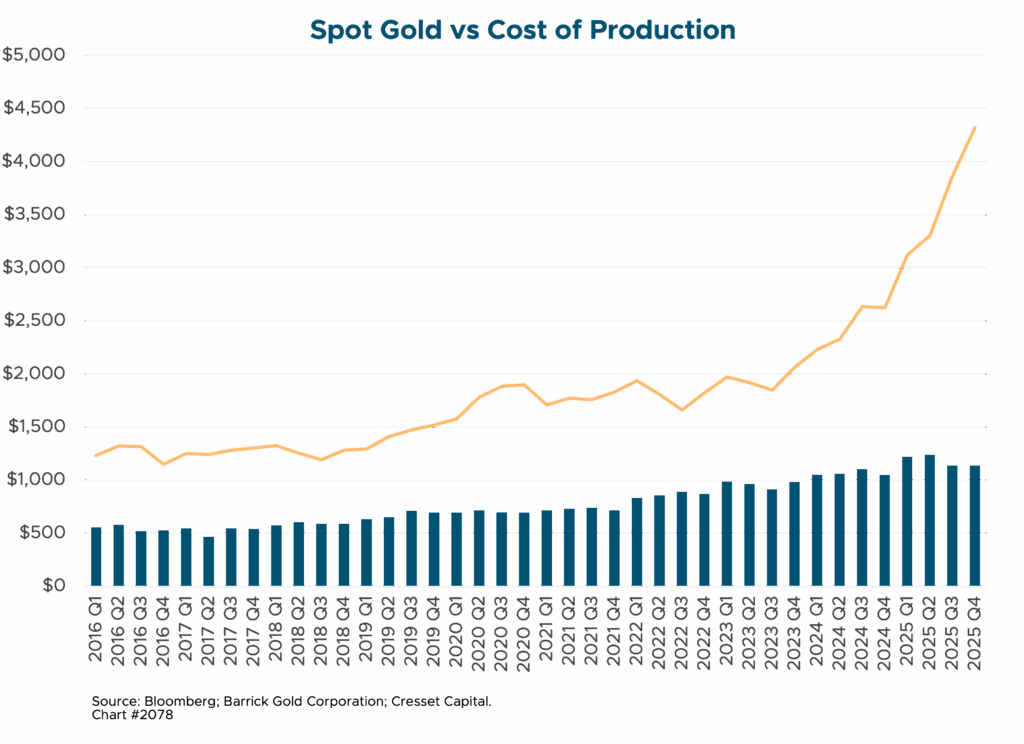
- Elevated prices are likely to incentivize increased mining activity and supply over time.
Gold has surged to record highs above $5,000 per ounce, with analysts maintaining a broadly bullish stance driven by geopolitical uncertainty, central bank demand, and monetary policy expectations. 2025 marked gold’s best calendar-year return since 1979, a period defined by double-digit inflation peaking at 13-14%, the Iran Hostage Crisis, and an energy shock that sent oil prices soaring. Those issues are a far cry from today’s financial market headlines. The meteoric move has grabbed investors’ attention, begging the question, should we get in?
Why Gold Defies Traditional Valuation
Unlike most asset classes, gold is very difficult to value, since it offers neither earnings nor dividends and has limited industrial uses. Distinct from virtually every other financial instrument, gold is an asset that doesn’t rely on the success of the issuer. The precious metal has a long, storied history dating back millennia.
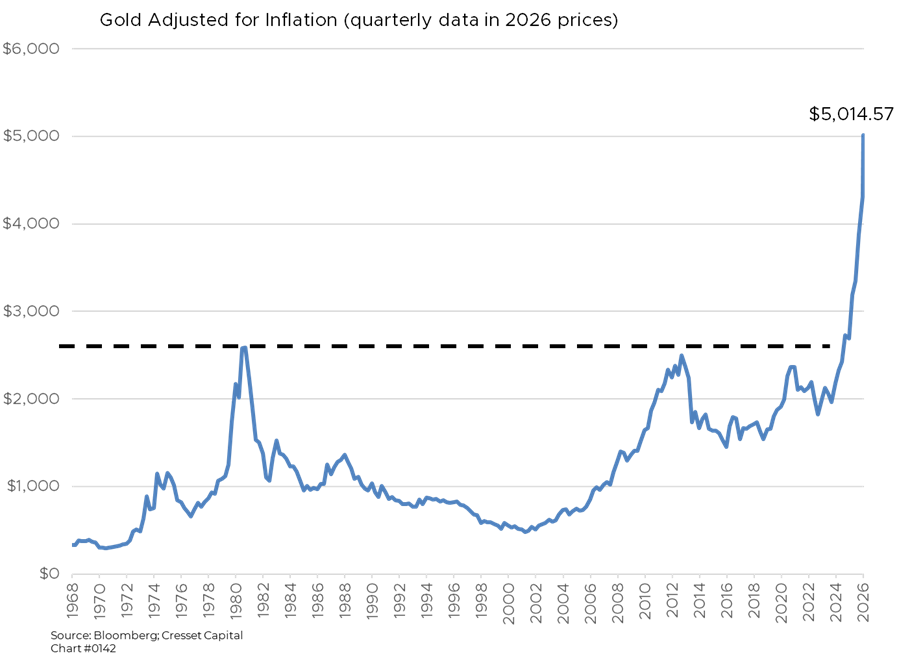
Cresset uses three perspectives when assessing gold. First, we view gold as a store of value. From that perspective, gold is extremely expensive. Gold has been a store of value dating back to Agamemnon, the king of Mycenae, believed to be around 1500 BCE. By maintaining its purchasing power, gold has been a useful inflation hedge thanks to its restricted supply. Unlike paper money, gold can’t be duplicated. However, based on today’s prices, gold is trading at an all-time high relative to inflation. Since 1968, gold previously peaked twice at about $2,500 per ounce in today’s dollars, making today’s $5,000 price extraordinary by historical standards.
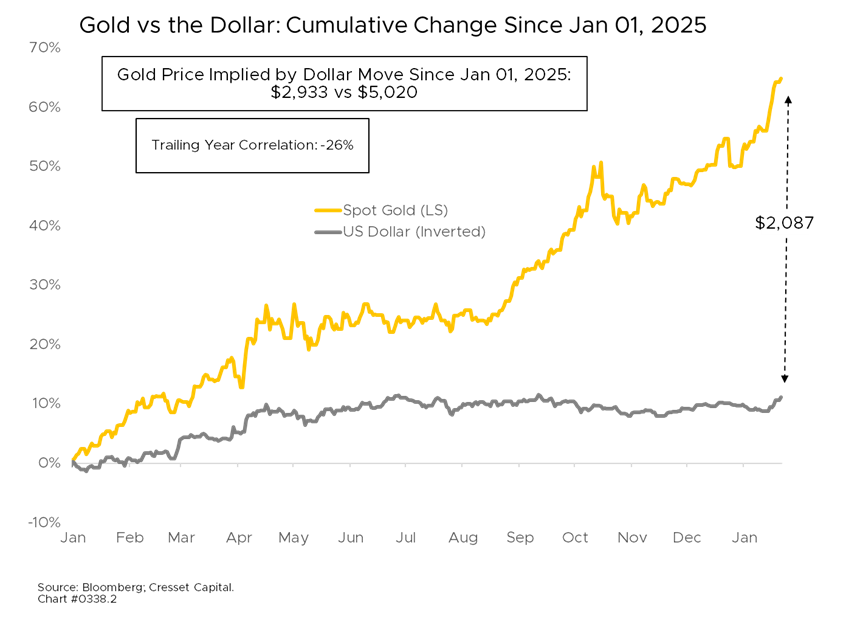
The second way we look at gold is as a hedge against dollar weakness. The dollar suffered one of its worst declines last year in over 50 years, yet dollar devaluation only explains a fraction of the gains gold enjoyed since the beginning of 2025. If gold were a pure dollar hedge, gold would be trading at $2,933, not $5,020, leaving $2,087 “unexplained.”
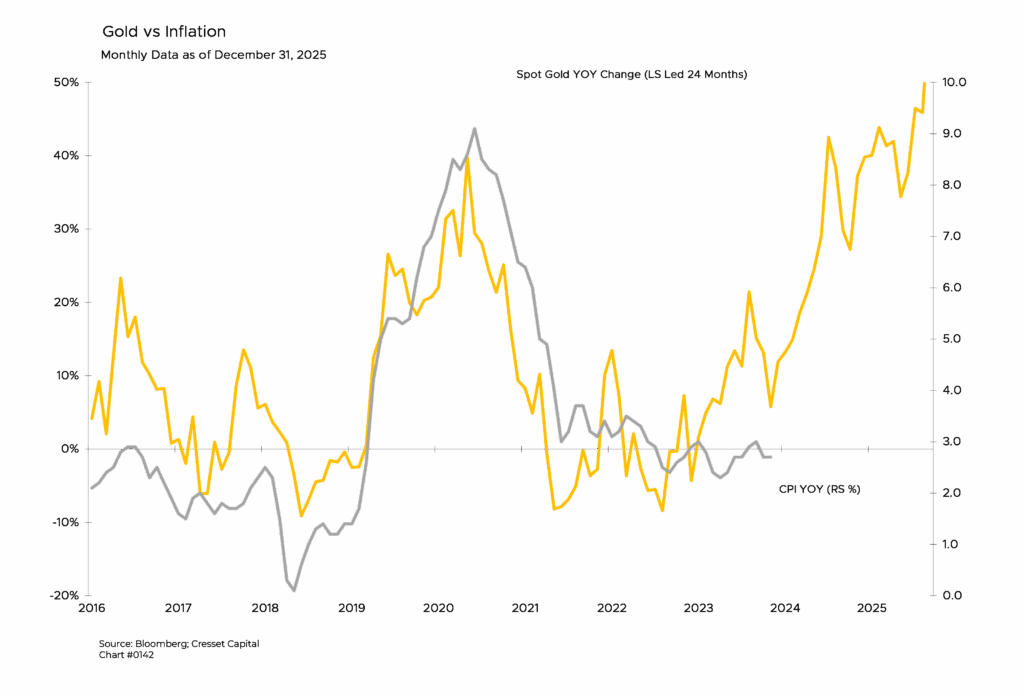
The third perspective we take on gold is as an inflation predictor, a store of value with a forecasting mechanism built in. History suggests that gold has tended to lead inflation by 24 months. Gold rallied 40% in 2020, two years ahead of year-over-year Consumer Price Index (CPI) peaking at nearly 9%. History suggests that CPI will rise steadily from now, reaching 10% by the end of 2027, based on its historical interaction with gold. Based on what we know, 10% appears too high, suggesting that today’s gold rally has run too far.
Structural Forces Supporting the Rally
Looking beyond our metrics, there are several factors supporting gold’s rally and continued climb. Central banks have become the primary source of gold demand since 2022, acquiring record volumes to diversify reserves and hedge against inflation. Central banks are price-insensitive buyers with enormous balance sheets, with India and China as the biggest buyers. India currently has a 50/50 split of currency reserves and gold reserves, with about $1 trillion in gold holdings. China, meanwhile, has a 90/10 split of currency reserves versus gold reserves, with $350 billion in gold reserves and $3.5 trillion in currencies. That suggests China would need to sell more than $1.5 trillion of their currency position to buy $1.5 trillion in gold to rebalance to a 50/50 mix.
Supply Response: Higher Prices Invite More Production
Today’s price will likely prompt increased production and supply. The cost of mining an ounce of gold 10 years ago was about $550. Gold was trading at around $1,200, leaving an operating profit of about $650. While production costs have risen to a little more than $1,200, today’s spot gold price widens operating profits to $3,800 per ounce. We expect mining activity to pick up.
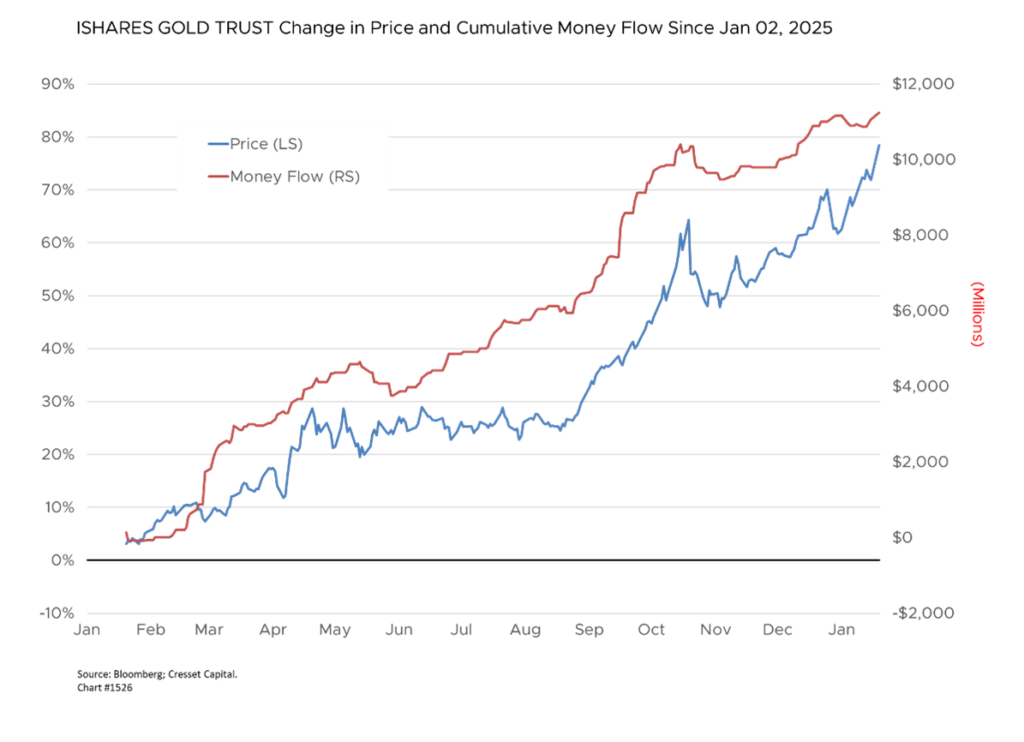
Demand for gold has been strong from U.S. investors. The iShares Gold Trust Exchange-Traded Fund (ETF), the largest gold ETF, enjoyed nearly $12 billion of inflows beginning in early 2025, reaching approximately $77 billion in assets under management. Shares outstanding have grown by nearly 30% over the last year. Collectively, ETFs hold $388 billion of gold.
Bottom Line
While the narrative favors gold, given policy uncertainty escalating public debt levels, the numbers don’t add up. Unless investors hope to hedge double-digit inflation in the coming years, we suggest investors who don’t own gold to sit tight.