

Key Observations:
- Consumer spending is increasingly concentrated among higher-income households, reshaping demand and earnings dynamics.
- Labor market weakness is becoming structural as worker mobility declines and long-term unemployment rises.
- Fiscal stimulus in 2026 provides a meaningful economic tailwind through tax cuts and refunds.
- Markets may be underestimating the scale and timing of potential rate cuts amid a Federal Reserve leadership transition.
- AI leaders remain highly profitable, but enterprise monetization continues to lag infrastructure investment.
- Concentration risk in AI supply chains leaves markets vulnerable to changes in hyperscaler capital spending.
As we enter 2026, the U.S. economy faces an unprecedented confluence of structural divergence, policy coordination, and technological speculation. Three critical themes define our investment outlook: the deepening “K-shaped” recovery—where economic momentum is diverging, with growth accelerating for some sectors while lagging in others—that bifurcates consumer spending power, the double-barreled stimulus combining aggressive fiscal expansion with dovish monetary policy, and the AI sector’s transition from infrastructure buildout to monetization reality. While these forces create significant opportunities in public and private investment markets, they also demand careful monitoring to help navigate heightened volatility and concentration risks. Given the run-up this past year in the technology sector, maintaining a consistent rebalancing of exposures will remain important.
The K-Shaped Recovery: Economic Bifurcation Intensifies
The American economy enters 2026 characterized by an accelerating K-shaped recovery where prosperity increasingly concentrates among affluent households while middle- and lower-income families face mounting financial pressures. This divergence has reached outsized proportions, with the top 20% of earners now driving nearly 50% of consumer spending, a level of concentration that may alter traditional economic dynamics.

Labor market deterioration provides the clearest evidence of this bifurcation. Unemployment has risen from 4.1% to 4.6% over the latter half of 2025, with particularly acute impacts on vulnerable populations. Black unemployment has surged to 8.3% from 6.1% at year-end 2024, reflecting both cyclical weakness and the disproportionate effects of federal workforce reductions. The long-term unemployed now represent 24% of all jobless workers, up from an 18% post-pandemic low, indicating structural challenges beyond typical cyclical patterns.

Fewer Job Switches, Slower Wage Growth, and a Strained Consumer
This employment weakness has created a self-reinforcing cycle of reduced worker mobility and constrained wage growth. The “quits” rate has fallen dramatically from 3% in 2022 to just 1.8%, as workers cling to existing positions rather than seeking advancement. Meanwhile, wage growth has decelerated to 3.5% annually, below the estimated 4% “sustainable” rate consistent with 2% inflation, removing inflationary pressures but constraining purchasing power. A declining quit rate will likely put downward pressure on wage growth.

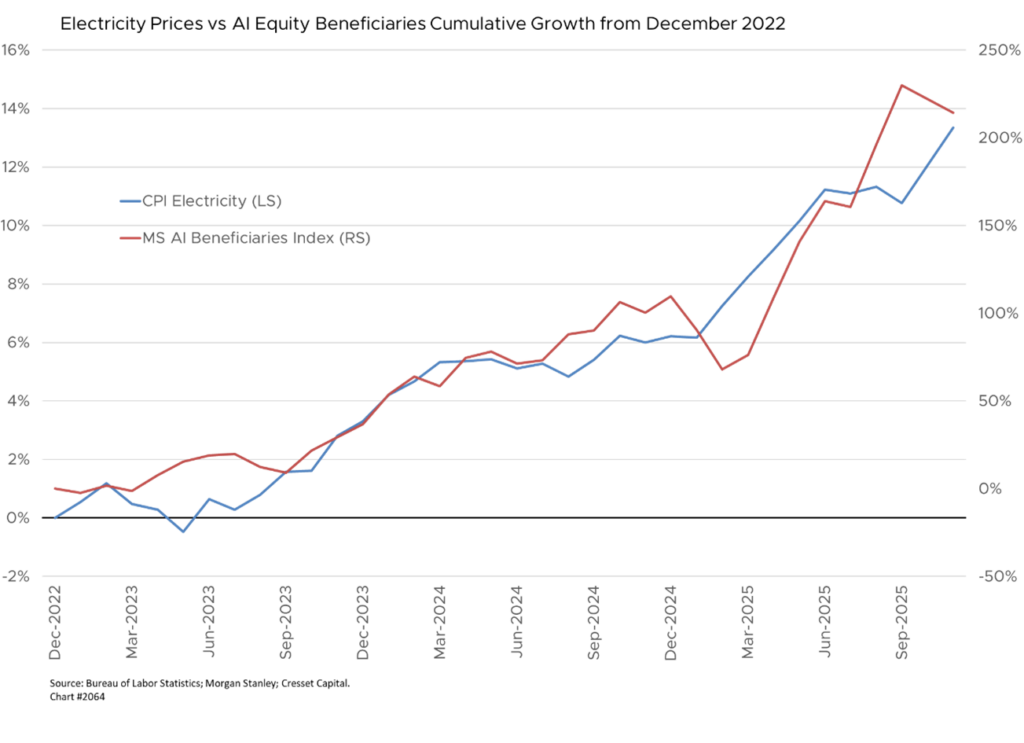
The consumer landscape reflects this bifurcation starkly. High-income households benefit from AI-driven stock market gains and accumulated wealth, enabling continued discretionary spending on luxury goods. Conversely, lower-income households increasingly rely on expensive credit card borrowing at average rates of 20% to make ends meet, as food prices have risen over 30% since the pandemic’s onset and electricity bills are now 40% higher.
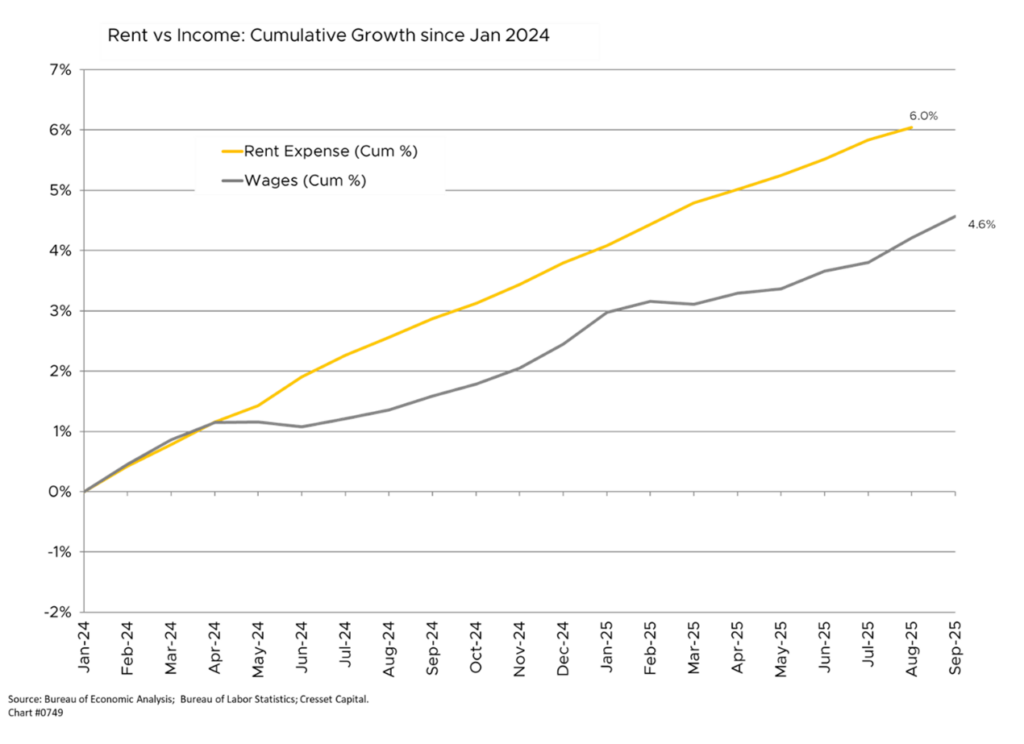
Consumer sentiment has plummeted to historic lows, remarkably registering 11 points lower than during 1980’s 13.5% inflation despite current inflation being dramatically lower at 2.7%. While wages are rising, expenses, like food and rent, are rising faster. This reflects the cumulative impact of persistent price pressures on purchasing power and suggests underlying economic stress beyond headline metrics.
Double-Barreled Stimulus: Policy Coordination Creates Opportunity
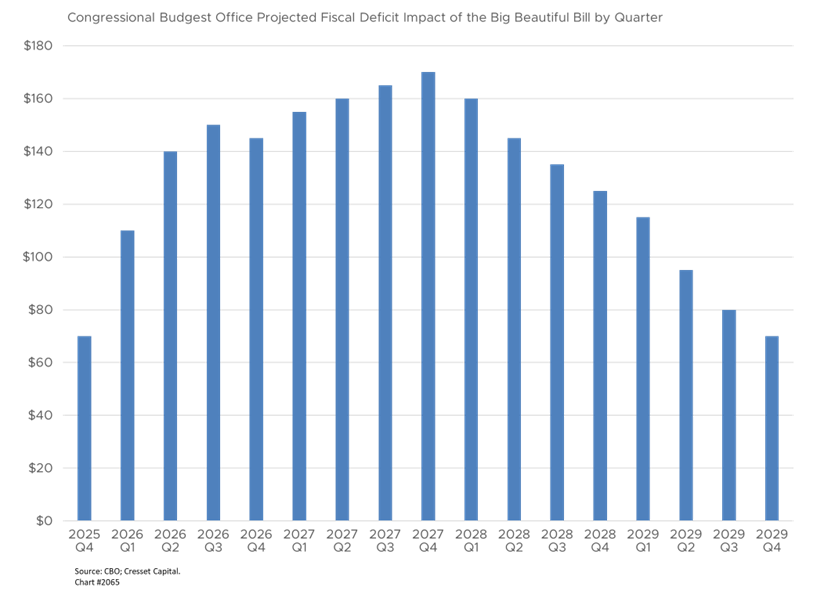
The one-two punch of aggressive fiscal stimulus with anticipated monetary easing creates an unusual but potentially powerful tailwind for 2026. The One Big Beautiful Bill Act represents the largest tax legislation since 2012, adding $3-4 trillion to deficits over ten years while providing immediate economic support.
Key provisions taking effect in 2026 include permanent extension of 2017 tax rates, enhanced standard deductions reaching $32,200 for married couples filing jointly, the State and Local Tax (SALT) deduction expansion from $10,000 to $40,000, and temporary exemptions for tips and overtime income. The Congressional Budget Office projects this will inject approximately $50 billion of additional tax refunds during Q1 2026, serving effectively as a new round of stimulus checks. Together with corporate tax cuts and other incentives, the CBO projects an additional $110 billion from the bill.
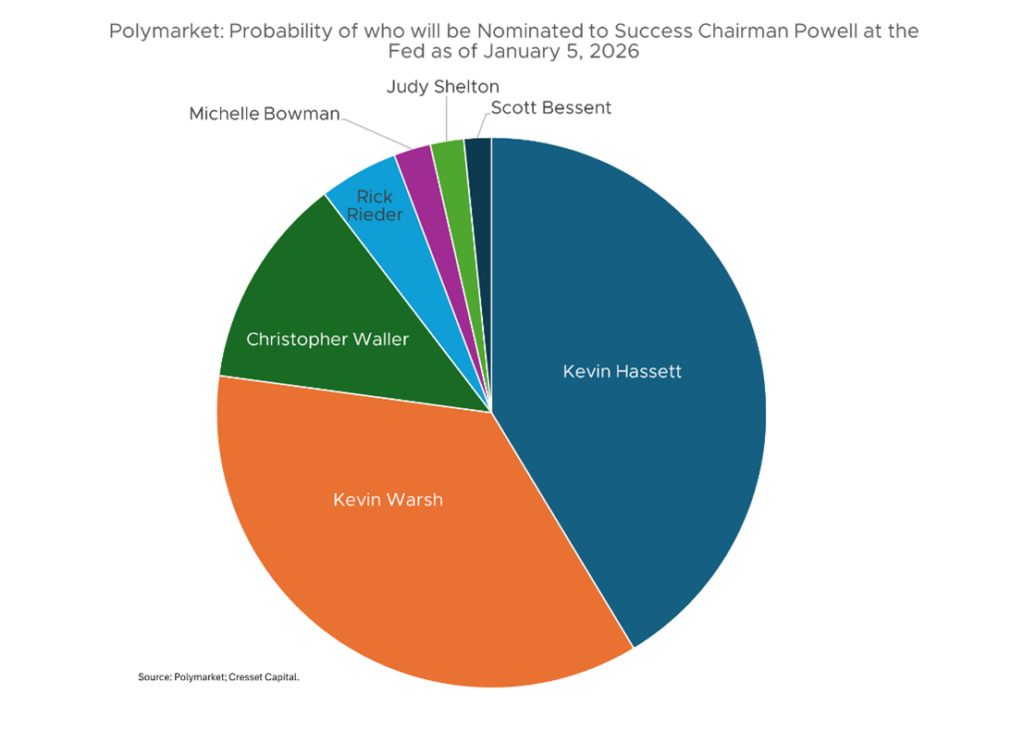
This fiscal expansion coincides with Federal Reserve leadership transition as Jerome Powell’s chairmanship expires May 15, 2026. Kevin Hassett leads the succession race with approximately 40% odds, favoring more aggressive rate cutting than current Fed projections suggest. While the Fed’s median forecast anticipates only one 25 basis point cut in 2026, markets price two to three cuts, creating potential for significant policy surprises.
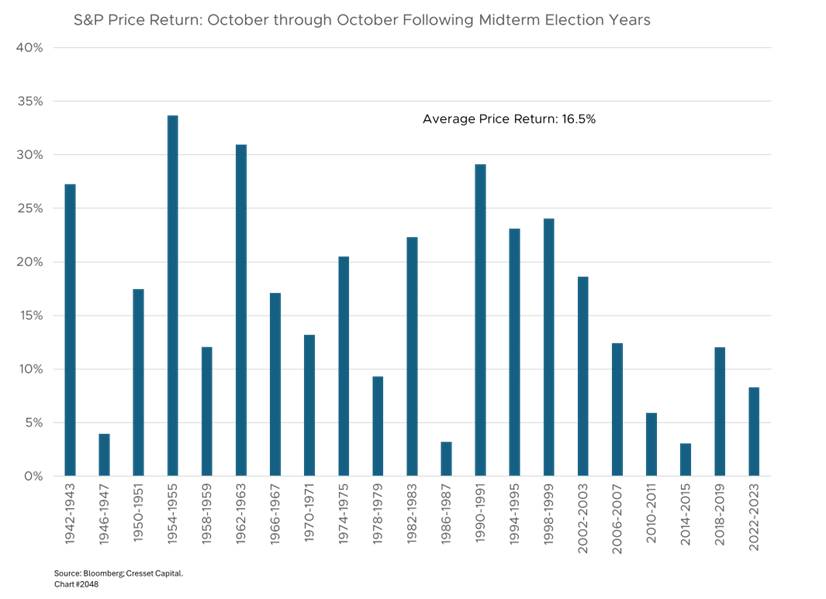
Markets Have Historically Rewarded This Setup, Though Risks Remain
Historical patterns strongly favor equity markets during this configuration. Post-midterm periods have averaged 16.5% S&P 500 returns since 1942, with no negative October-to-October returns following midterms in that timeframe. We expect the combination of fiscal stimulus and monetary easing to flood liquidity into the economy, paving the way for a refinancing cycle and increased deal volume in both public and private markets.
However, this policy coordination carries risks. The combination could raise late-2026 rate hike expectations if inflation pressures resurface, while questions about Fed independence may create bond market volatility. Additionally, the incoming Fed chairman might implement unconventional policies like yield curve control, adding complexity to fixed-income positioning.
AI Investment Reality Check: Infrastructure Meets Monetization
The artificial intelligence sector faces a critical inflection point that will define market leadership for the next decade. While often characterized as a bubble, today’s AI cycle differs meaningfully from dot-com era speculation through its foundation of profitable operations and measurable revenue growth.
Current valuations appear elevated but remain structurally different from historical extremes. NVIDIA trades at 44-47 times past earnings versus Cisco’s 472 times at the March 2000 peak, while the “Magnificent Seven” collectively trade at roughly 28 times expected earnings, about half the tech sector’s dot-com valuation. Crucially, these companies generate substantial profits, with NVIDIA delivering $99 billion in trailing twelve-month profit at 53% net margins.
Infrastructure Spending Surges Ahead of Revenue
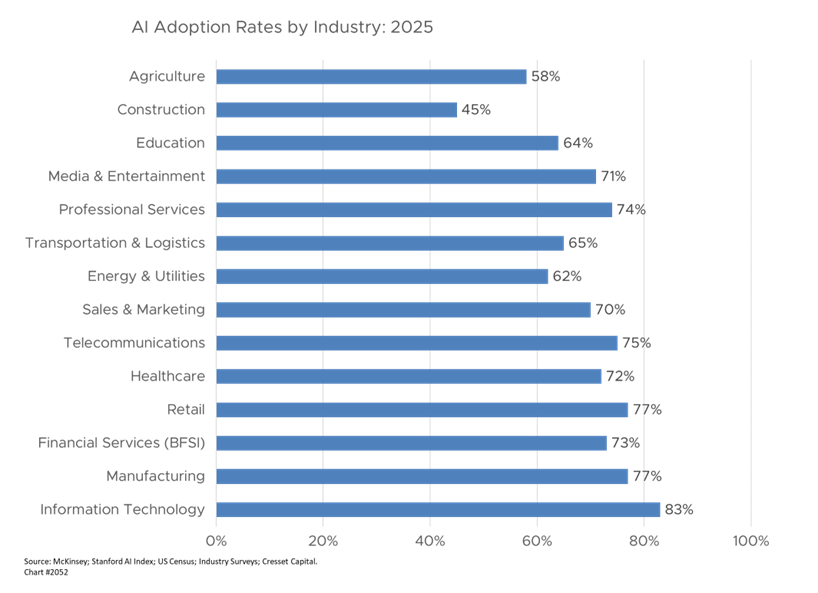
However, a concerning infrastructure-to-revenue disconnect has emerged. Hyperscalers committed nearly $400 billion in 2025 capital expenditure while enterprise AI generates approximately $100 billion in actual revenue. An MIT study found 95% of Generative AI pilot programs fail to achieve business value, with only 5% of enterprises reporting significant EBIT impact despite 78% adoption rates. We are hearing stories of Generative AI and advances in robotics having a positive impact in some companies, but the widespread positive impact is not yet evident.
This pattern echoes historical infrastructure over-investment cycles, though with critical differences. Unlike dot-com era fiber optic investment funded primarily through debt, AI infrastructure benefits from over $200 billion in annual mega-cap tech free cash flow, providing greater staying power through disappointment cycles.
Concentration Risk Shapes 2026 Positioning
Concentration risks remain significant, with NVIDIA deriving 85% of revenue from six customers and the top four accounting for nearly 60% of sales. Any capital expenditure pullback from Microsoft, Amazon, Google, or Meta would cascade through NVIDIA’s results and broader AI supply chains.
The 2026 investment landscape demands nuanced positioning across these three dominant themes. The K-shaped recovery suggests continued market price improvements in sectors where investors benefit from the wealth effect of higher equity markets. The stimulus generated by tax refunds will help the lower income sector. However, following the refund season we would expect these sectors to feel some headwinds to revenue growth. We will be cautious around investments in sectors that could be affected by customers trading down to lower priced products Double-barreled stimulus and high valuations in the mega cap companies favor equity market broadening.
We are still comfortable with continued investment in the AI theme, although we recognize the concentration carries heightened stock-specific risk, and we don’t expect 100% success by those companies.
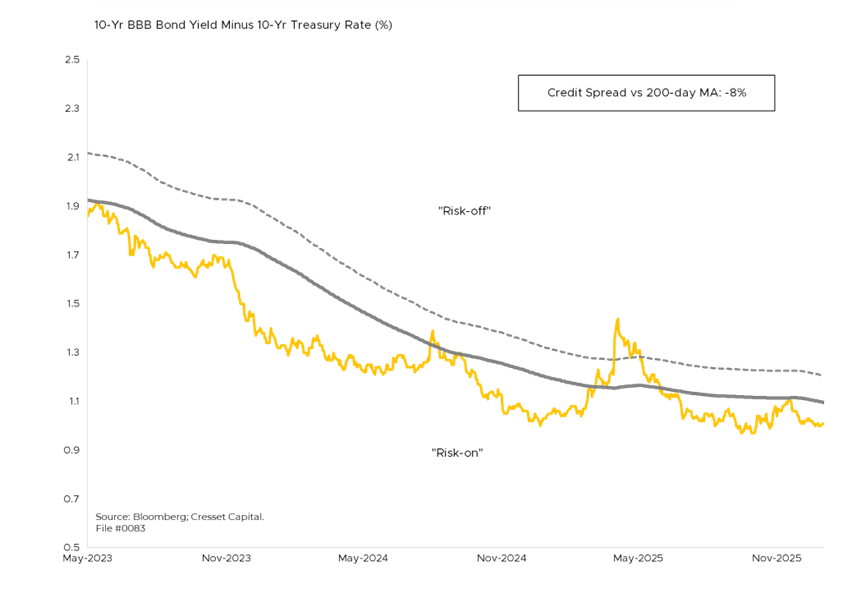
Fixed-income investors should emphasize intermediate duration of 5-10 years to capture elevated yields before anticipated Fed cuts materialize, while municipal bonds offer compelling opportunities beyond 10-year maturities. Liquidity expansion through fiscal and monetary stimulus enhances the opportunity set in private markets, private equity, private credit, and real estate. Despite headlines, we are seeing accelerating recovery in real estate and more transaction realizations in private equity. As of this writing, there has not been a deterioration in credit markets, and credit spreads do not suggest a heightened level of worry.
Bottom Line:
Success in 2026 requires balancing these crosscurrents: capturing policy-driven opportunities while managing AI concentration risks and the bifurcated consumer economy. The economy’s resilience will ultimately be tested by its ability to broaden prosperity beyond current bifurcation, creating sustainable growth that benefits both Main Street and Wall Street. Investors who position thoughtfully across these themes while maintaining defensive flexibility should be well-positioned to navigate the year’s challenges and opportunities.