

Key Observations:
- Breadth gauges how many stocks are participating in a market move
- Market breadth metrics deteriorating despite record index levels, recently hitting historic low
- Narrow market breadth = higher risk of correction or increased volatility
Market breadth is currently signaling caution for investors. While major indices like the S&P 500 and the NASDAQ are making new highs, the rallies have become increasingly narrow, fueled by gains in a handful of large-cap technology stocks. Most S&P constituents remain stuck in neutral or have declined, meaning the broader market is not participating in the upside – an unhealthy sign for market stability in the months ahead.
Breadth Gauges How Many Stocks Are Participating in a Market Move
Breadth is usually tracked through indicators such as the advance-decline line, the percentage of stocks above key moving averages, or the ratio of advancing to declining stocks in major indices. When market breadth is strong, participation is extensive, like when most stocks rise along with the index. Weak breadth means only a select group of stocks are driving gains and many others are stagnating or even falling.
Recent Market Breadth Indicators Deteriorating Despite Record Index Levels
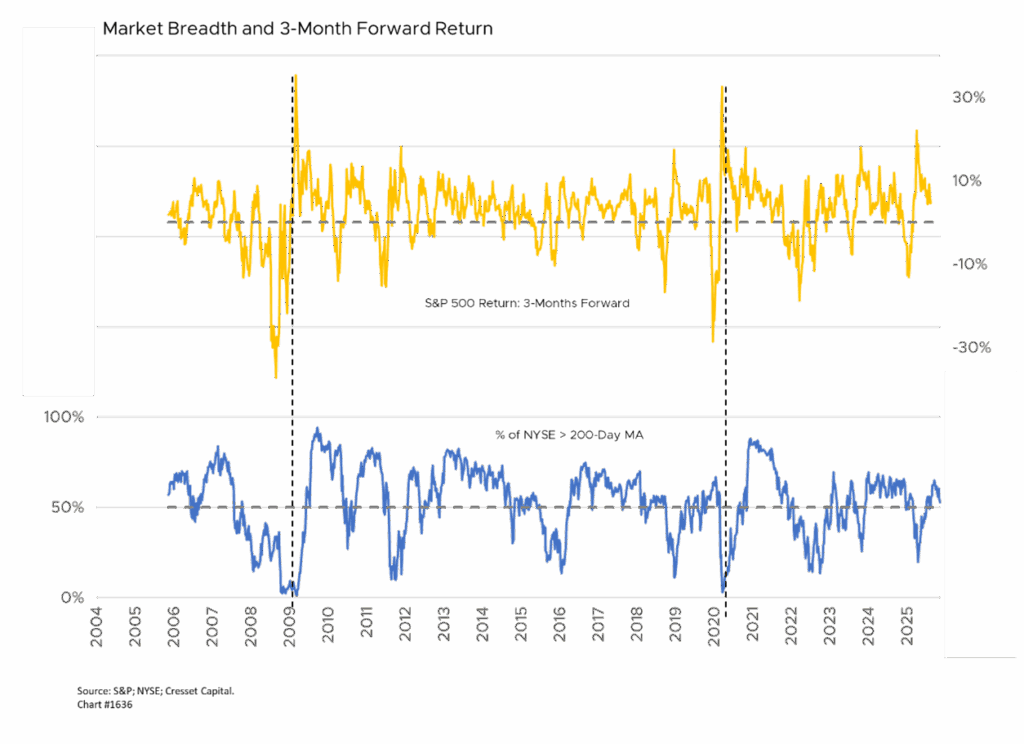
For example, only about 40 per cent of S&P 500 stocks are trading above their 50-day moving average, down from 80 per cent just a few months ago. The proportion above the 200-day average is barely above 50 per cent, and the advance/decline line peaked as far back as July. These readings signal that while some stocks, mainly mega-cap tech, continue to outperform, the majority are either flat or losing ground. It is interesting to note that once the share of S&P constituents trading below their 200-day moving average exceeds 90 per cent, a bullish move ensues. We’re a long way from 90 per cent now, though.
Market Breadth Recently Hit Historic Low
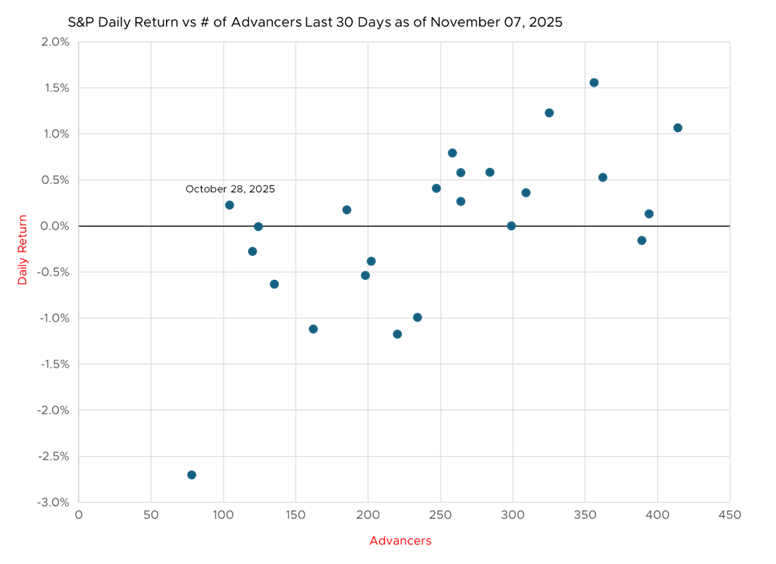
October 28 marked an historic low for market breadth on an S&P 500 up day, with only 104 stocks rising versus 398 declining within the Index. It coincided with investor optimism over Trump-Xi trade negotiations. Chipmakers NVIDIA and Intel rallied five per cent while the Index overall was up only fractionally. It marked the worst net advance/decline reading in over 30 years when the Index was simultaneously making new highs, underscoring just how concentrated the rally has become.
Narrow Market Breadth = Higher Risk of Correction or Increased Volatility
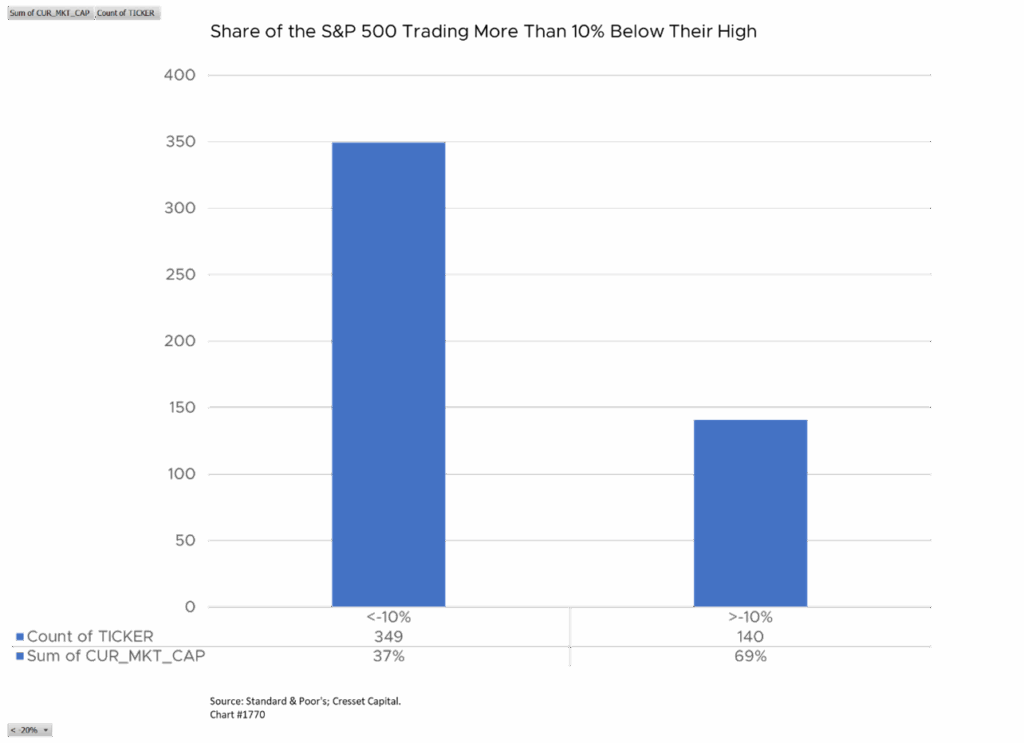
When only a few stocks are driving market gains, any setback in those leaders, whether due to earnings disappointments, regulation, or macro events, can have an outsized negative effect on the entire market. Historically, periods of poor breadth preceding new highs have foreshadowed difficult environments. Though the market could continue rising for a while, if breadth does not improve it increases the vulnerability to pullbacks. The leadership of mega-cap tech stocks like NVIDIA, Amazon, and Alphabet has helped propel indices higher. However, 70 per cent of S&P 500 stocks now trade more than 10 per cent below their highs, showing a stark divide between the winners and the rest of the market.
Bottom Line:
Today’s market breadth is sub‐par for a sustainable broad-based rally. While the headline index may look comfortable, the internals suggest a fragile advance supported by a narrow constituency of stocks. For investors, the prudent path is to lean toward selectivity, ensure diversification, and await stronger breadth confirmation before making bold directional commitments. If breadth improves, the bullish case gains momentum. Until then, defensive guardrails and realistic expectations are warranted.