

Key Observations
- Oil shocks alone do not create stagflation; wage-price spirals and policy errors do.
- Today’s U.S. economy is far less energy-intensive than in the 1970s.
- Union power and broad wage indexation, which were critical drivers of 1970s inflation, are structurally weaker today.
- Elevated oil prices are more likely to compress margins and slow growth than ignite a sustained inflation spiral.
- The Federal Reserve’s inflation-fighting credibility is significantly stronger than during prior stagflation episodes.
- The current risk is “stagflation-lite,” not a 1970s-style macro regime shift.
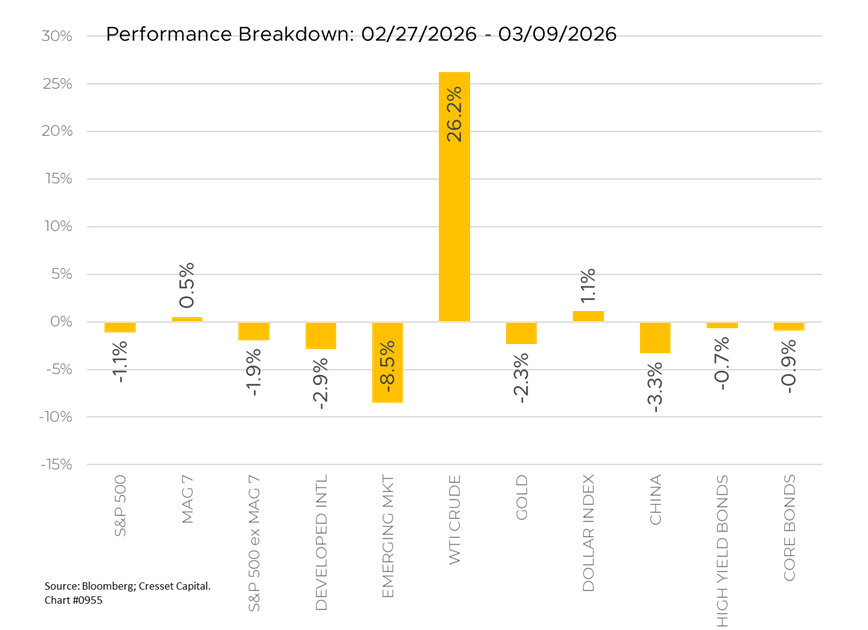
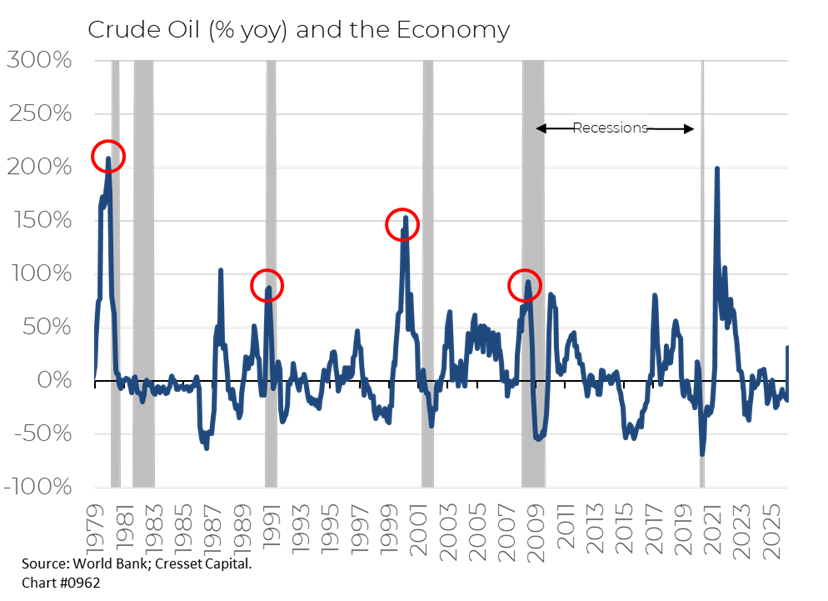
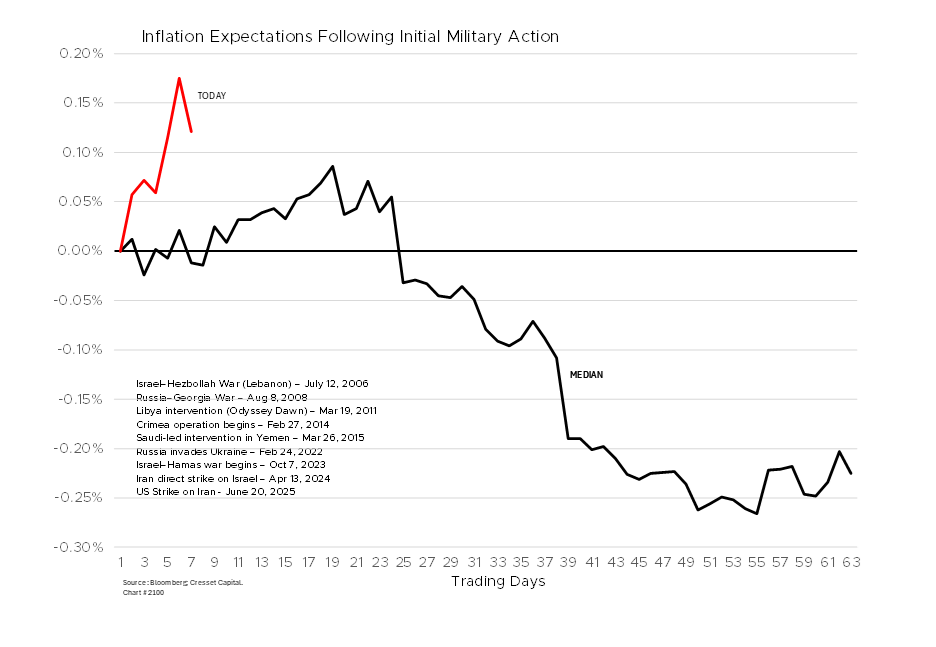
Operation Epic Fury, the U.S.–Israel military campaign against Iran, is entering its second week, and market participants are bracing for a longer conflict. Brent crude surged toward $120 per barrel Monday morning, its largest single-day swing in nearly six years, before easing back to around $100 after G7 finance ministers signaled a potential coordinated release of oil reserves. West Texas Intermediate (WTI) crude nonetheless settled nearly 10% higher on the session.
Equity markets bore the brunt. Roughly $6 trillion in global equity market capitalization has been erased since the conflict began. Asian markets opened the week sharply lower, with foreign investors pulling $14.2 billion from emerging Asian stocks excluding China, the largest single-week outflow on record going back to at least 2009.
Meanwhile, the bond market offered no shelter. Ten-year Treasury yields climbed to 4.15%, extending their longest advance since August, as inflation fears overwhelmed the growth-slowdown narrative that would ordinarily support duration. UK short-dated yields have surged nearly 60 basis points since the war began. Markets do not expect the Federal Reserve to cut rates before September. Gold fell rather than rallied, dropping 1.7% to around $5,086 per ounce as the dollar strengthened and rising rate expectations weighed on the metal.
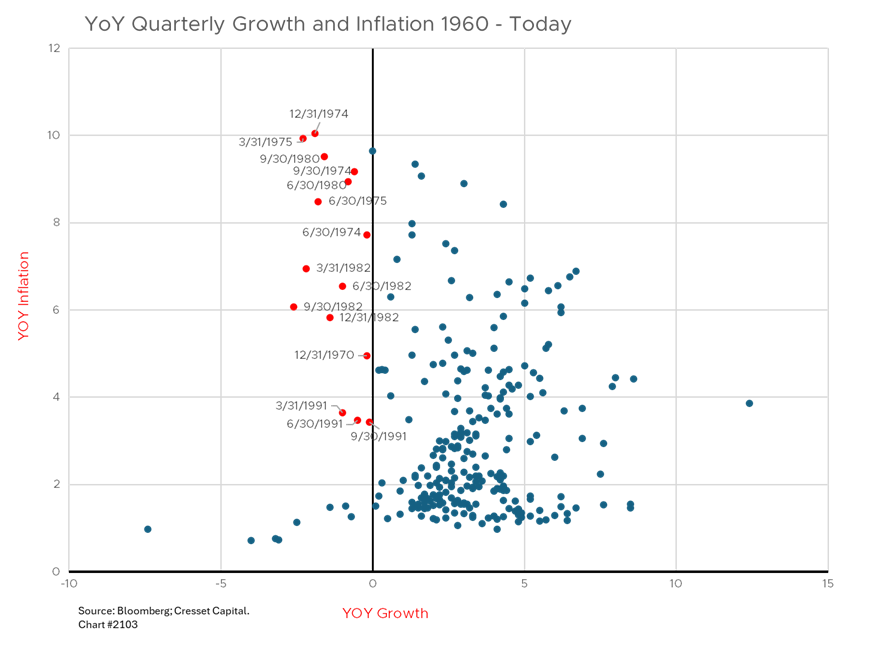
The historical record on stagflation is both instructive and sobering. Modern U.S. economic history offers three meaningful stagflationary episodes: the early 1970s, the 1973–74 oil shock, and the 1978–80 second oil crisis. Each offers distinct lessons; however, we believe today’s energy price spike will not metastasize into an inflation spiral.
Episode One: 1969–1971
The first stagflationary tremor preceded the oil shocks and is often overlooked. A volatile blend of Vietnam War spending, Great Society programs, and Nixon’s reluctance to tighten fiscal policy fueled inflation as the economy softened. The S&P 500 fell roughly 36% from its 1968 peak to its 1970 trough. Notably, it was not a commodity-driven inflation, yet growth equities, the “Nifty Fifty,” suffered disproportionately as discount rates rose. The episode established an early lesson: when the macro regime shifts from disinflation to stagflation, valuation multiple compression arrives before earnings deterioration, punishing expensive growth stocks first.
Episode Two: 1973–1974
Triggered by the Organization of the Petroleum Exporting Countries (OPEC) oil embargo and compounded by Nixon’s wage and price controls, the collapse of Bretton Woods, and a Fed that was behind the curve, energy costs spurred inflation just as growth deteriorated. The S&P 500 declined approximately 48% from peak to trough in nominal terms, and significantly more in real, inflation-adjusted terms. This period remains one of the worst equity bear markets of the 20th century on a real basis.
Neither traditional equity nor fixed income worked between 1973 and 1974. Oil and gas producers did deliver extraordinary returns, as did mining and materials companies. Gold, freed from its fixed peg following the end of Bretton Woods, surged, rising from $35 per ounce in 1971 to over $180 by 1974. International equities, particularly those tied to commodity exporters in Canada, Australia, and parts of Latin America, held up considerably better than U.S. domestic stocks.
Episode Three: 1978–1980
The second oil shock, precipitated by the Iranian Revolution, produced a near-identical macro backdrop. The S&P 500 experienced significant volatility and negative real returns throughout the period. What distinguished this episode was the Volcker Fed’s eventual decisive response: a willingness to impose punishing recessions to kill inflation. The equity market bottomed not when growth recovered, but when the inflation credibility battle was won and real rates peaked.
Like the 1973-1974 period, commodity and real asset themes dominated. Energy stocks, measured by what would become the energy sector of the S&P, outperformed dramatically. Integrated oil majors compounded at double-digit annual rates. Infrastructure, pipelines, utilities with commodity exposure, and resource royalties provided both income and inflation protection.
This time international diversification delivered. International developed markets, particularly resource-weighted economies, posted better real returns than U.S. large-cap equities. Currency dynamics also mattered. The dollar weakened meaningfully in the late 1970s, boosting international returns for U.S.-based investors on a hedged basis.
Why We’re Not Worried About Stagflation
While the historical stagflation playbook is a vital reference, there are meaningful structural differences in the current environment that argue against a sustained inflationary spiral. The most important is demand destruction. At $100 or more per barrel, energy functions less as a revenue transfer from consumers to producers and more as a tax on economic activity. The 1970s episodes were characterized by wage-price spirals in deeply unionized labor markets with significant pricing power, and that institutional architecture largely no longer exists. Union membership in the U.S. has declined from roughly 27% of the workforce in 1970 to under 10% today, sharply limiting workers’ ability to demand compensating wage increases.
Second, the energy intensity of the U.S. economy has fallen dramatically. The U.S. economy requires roughly half the energy input per dollar of GDP today compared to 1973, meaning the pass-through from crude prices to core inflation is structurally muted. Third, the broader backdrop entering this shock is one of softening demand rather than overheating, as the AI investment cycle had already begun to plateau, credit conditions were tightening, and consumer balance sheets were under pressure from two years of elevated rates. Energy-driven price spikes in a slack economy tend to compress margins rather than ignite generalized inflation.

Finally, the Federal Reserve’s credibility anchors expectations in a way it simply did not in the 1970s. Inflation expectations remain relatively well-anchored even as oil spikes, and the bond market’s reaction has been measured relative to the magnitude of the commodity move itself. The risk is better described as stagflation-lite, a growth slowdown accompanied by a temporary inflation overshoot rather than a self-reinforcing spiral, and that distinction matters enormously for portfolio construction.
Bottom Line
Without the direct linkage between high energy prices and inflation, the Federal Reserve’s job becomes easier than investors believe. At the same time, the U.S. central bank’s credibility is far stronger than it was in the late 1970s. While persistently high energy prices could slow economic growth, near-term fiscal stimulus anticipated from the One Big Beautiful Bill Act (OBBBA) and lower interest rates will offset energy headwinds. For that reason, we are increasing our recession probability this year to 25% from 20%, while reducing the likelihood of our base case — steady growth and slowing inflation — to 55% from 60%. We still recommend owning quality companies with persistent dividend growth.