Key Observations
- The U.S. housing market remains locked in a low-volume, high-price equilibrium as near-7% mortgage rates constrain affordability and keep existing homeowners from selling.
- Mortgage rates remain the market’s primary constraint, with the 30-year fixed rate at 6.95% and the lock-in effect limiting both housing supply and transaction activity.
- Housing starts and permits weakened in August, while a sharp decline in multifamily construction could create renewed pressure on rental supply and inflation in the years ahead.
- Builder confidence remains near multiyear lows as high rates, labor shortages, and elevated material costs make it difficult to reduce prices or build at more affordable price points.
- Housing demand remains subdued, with pending sales down year over year and mortgage applications weakening as higher rates weigh on both purchases and refinancing.
- Housing is acting as a persistent economic headwind, weighing on residential investment and downstream spending while limiting the effectiveness of monetary policy.
Housing data is on tap over the coming weeks as skeptical investors look for some signs of strength in an otherwise moribund sector. August new home sales, due Thursday, will offer a read on whether builder incentives are still buying volume or whether near-7% mortgages have finally overwhelmed them. Meanwhile, MBA mortgage applications are due Wednesday, followed by Freddie Mac’s 30-year rate Thursday. The latter is now on a four-week climb, and a fifth consecutive increase would be difficult to dismiss as noise. Case-Shiller and FHFA home prices land the following Tuesday, giving a sense of home price stability.
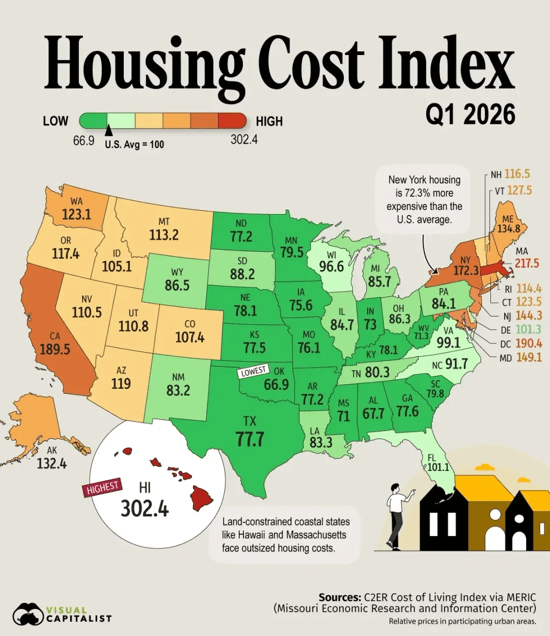
The U.S. housing market is frozen. Prices are steady, but the machinery that converts household formation into transactions, construction, and downstream consumption has stopped turning. With mortgage rates near 7%, builder confidence is at multiyear lows and starts below 1.3 million. Existing-home sales tracking barely above 4 million units describe a market locked in a low-volume, high-price equilibrium. Housing has a volume problem, not a credit problem, which changes both the risks worth underwriting and the assets likely to re-rate when conditions shift.
Residential real estate is a foundational building block of the U.S. economy. Housing’s share of the economy was 15.8% in Q2 2026, down from 15.9% in Q1, its lowest level since 2019. Growth can be broken down into cyclical homebuilding and remodeling at 3.7% of GDP and housing services, like rent and imputed rent, at 12.1%.
Residential investment covers new single-family and multifamily construction, remodeling, manufactured homes, and brokers’ fees, while housing services encompass gross rents and utilities paid by renters plus owners’ imputed rent and utilities. Imputed rent is included by long-standing national accounting convention; without it, a rising homeownership rate would inaccurately shrink measured GDP. It also accounts for nearly one-third of CPI.
Taken together, real estate data alone understates housing’s cyclical importance to the economy. That’s because downstream spending, which follows purchases such as appliances, furniture, flooring, paint, moving services, title, and origination fees, is counted elsewhere in GDP under retail, durable goods, and financial services.
Mortgage Rates: The Binding Constraint
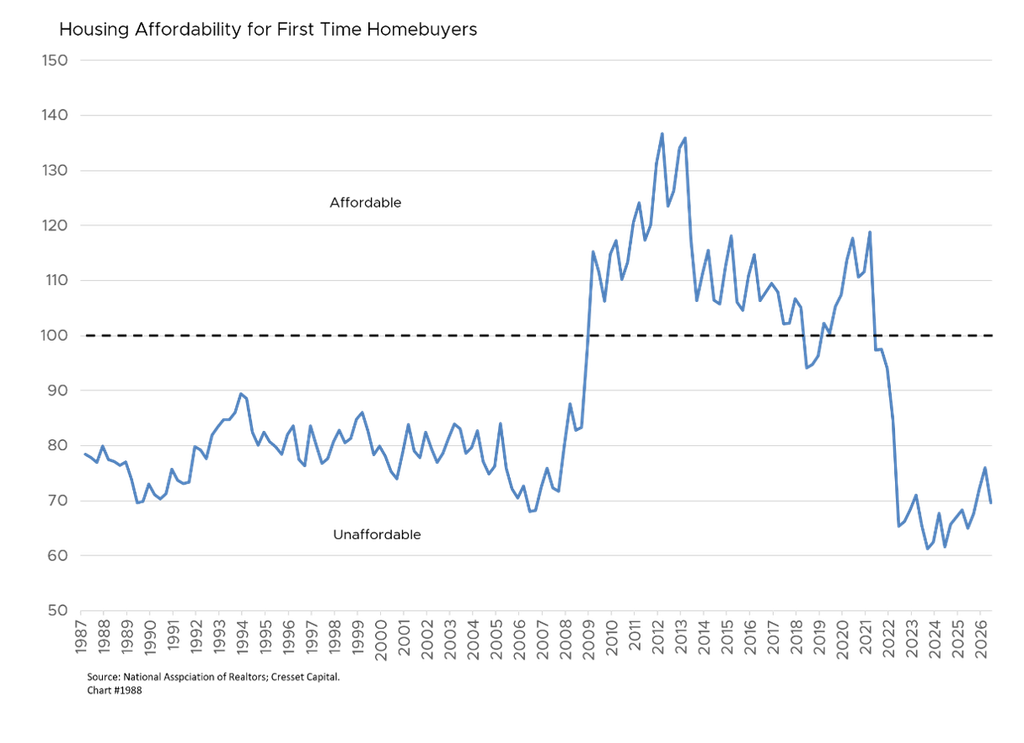
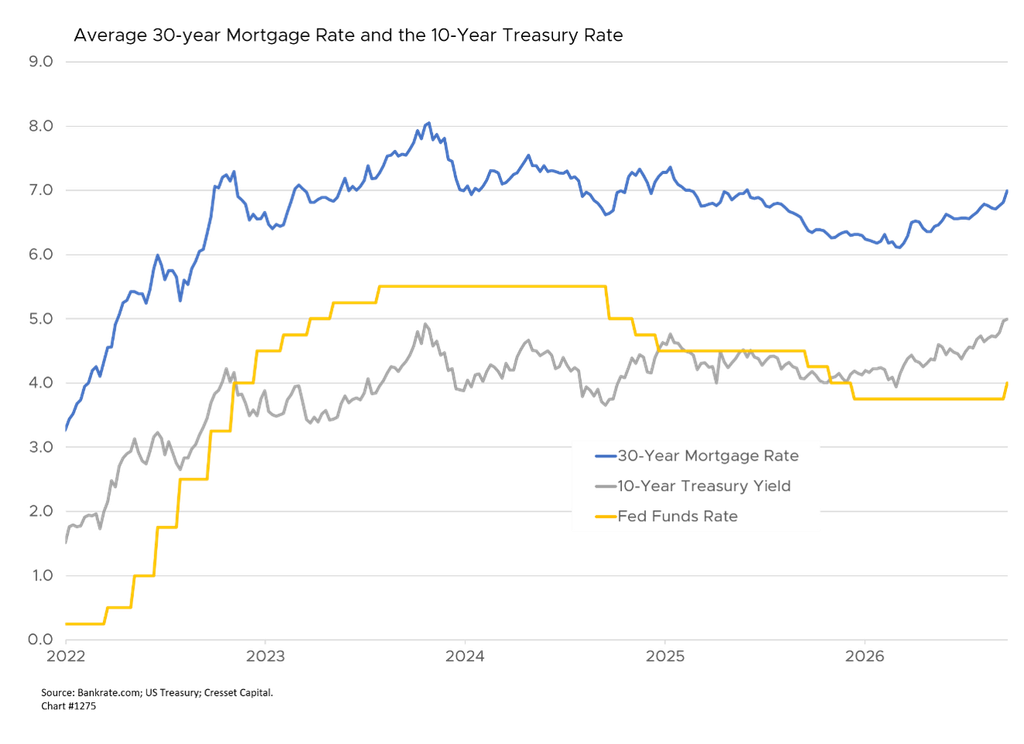
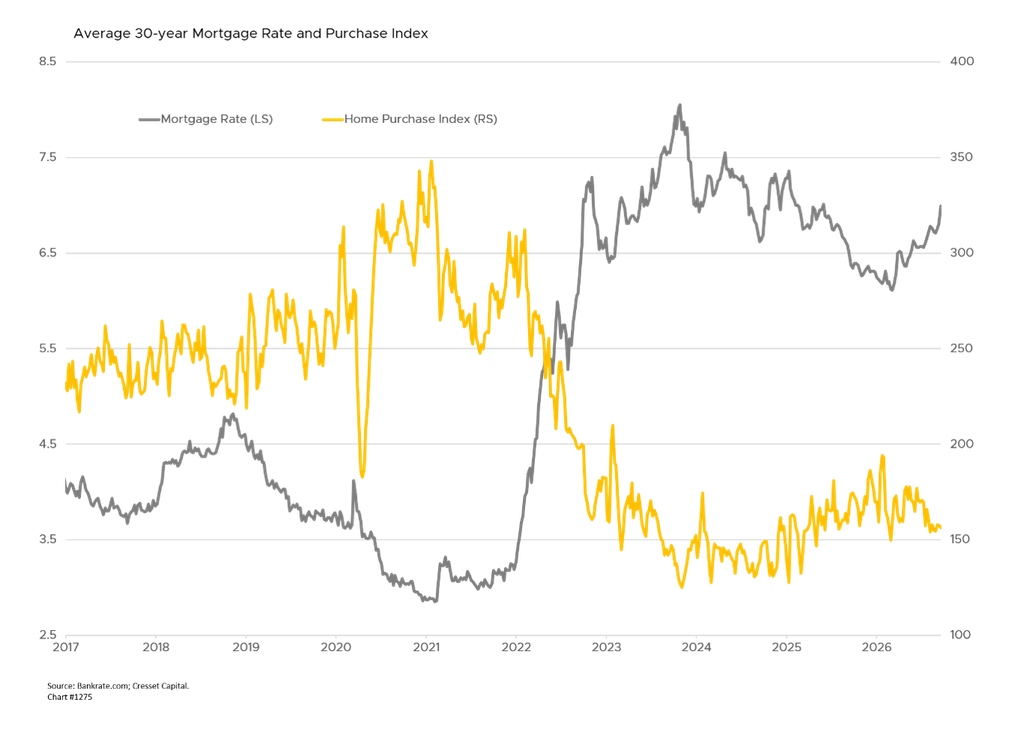
The mortgage rate drives virtually everything in housing, and it moved the wrong way. The 30-year fixed rate rose to 6.95% this week, a fourth consecutive weekly increase and the highest reading since January 2025. A year ago, it stood at 6.26%. That 70-basis-point move is the single most consequential fact in the market, and at nearly 7%, the monthly carrying cost on a median-priced home remains prohibitive for a large share of prospective buyers.
The mortgage rate matters more than the Fed policy rate. The 30-year mortgage is priced off the 10-year Treasury plus a primary-secondary spread that has remained historically wide. Fed easing does not mechanically deliver mortgage relief.
Supply
August housing starts fell 2.6% to an annualized rate of 1.275 million, missing consensus of 1.32 million and marking one of the softest prints since the pandemic. Permits fell 2.7% to 1.394 million, also below expectations. Total starts are down roughly 1.2% year over year.
A near-22% collapse in multifamily starts drove the decline. Multifamily had been absorbing rental demand generated by unaffordable homeownership, serving as the market’s pressure-release valve and one of its few performing segments. The reduction in starts is a medium-term rent-inflation setup, because units not started in 2026 are units not delivered in 2028.
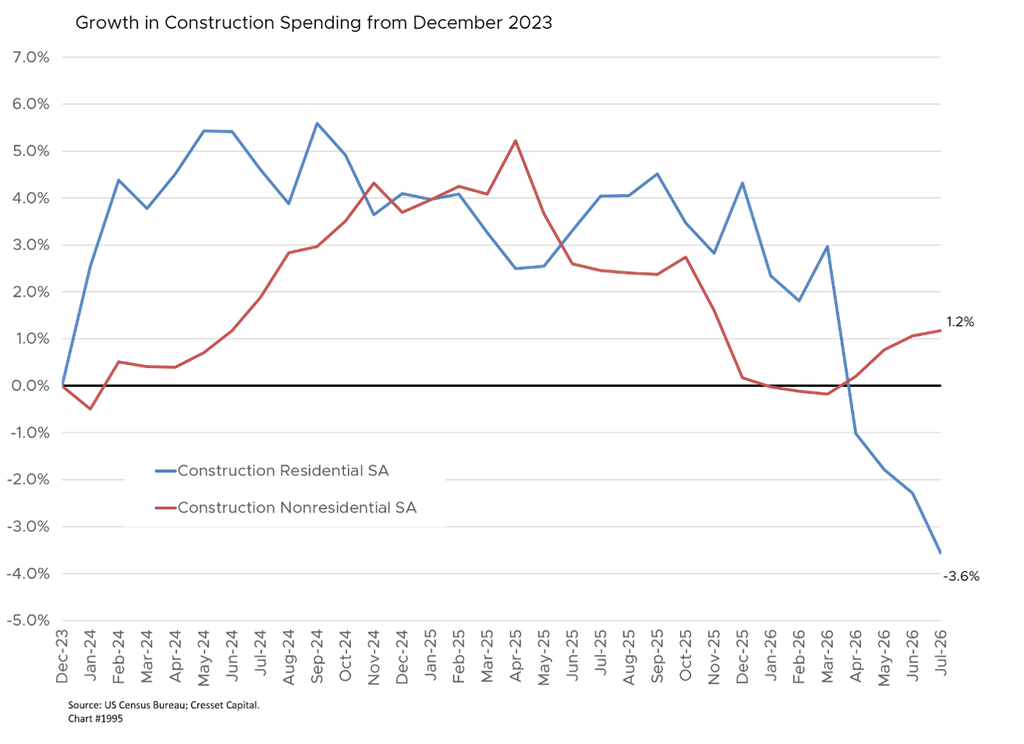
Builder sentiment confirms the read. The NAHB/Wells Fargo index fell three points to 32 in September, the weakest since September 2025, with builders citing rates, worker shortages, and elevated material costs. Any reading below 50 means more builders judge conditions poor than good; 32 is a contraction signal. Buyer traffic has weakened across much of the country.
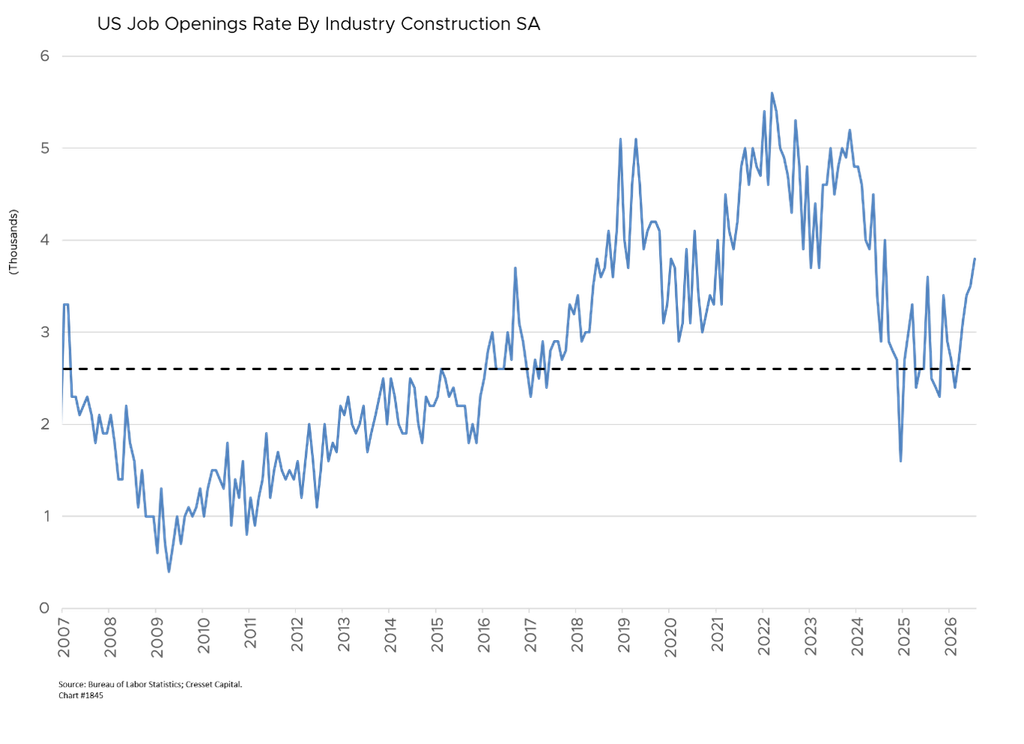
At the same time, labor scarcity and materials inflation squeeze builders from both ends. Builders cannot cut prices to clear inventory without destroying their margins, nor can they build cheaply enough to reach affordable price points. That explains the reduced volume rather than lower prices.
Demand
Pending home sales rose 0.3% in August to 71.2, the first increase since May and modestly better than consensus expectations for a small decline. The gain was regionally concentrated, with the South up 2.3% and the West up 3.0% against declines of 4.2% in the Northeast and 1.6% in the Midwest.
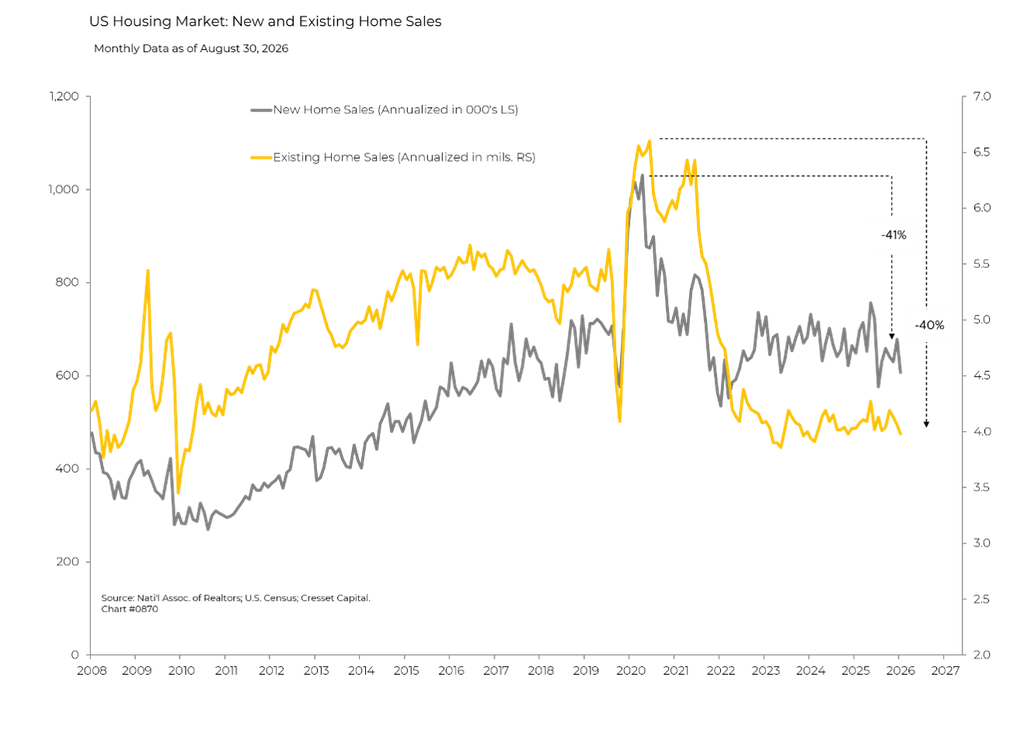
Pending sales, however, fell 4.9% year over year and sit at a level far below what would be expected in an expanding economy. Mortgage applications tell the cleaner story. The MBA index fell 4.1% in the week ending September 11, with refinancing down 8.8% as rising rates eliminate the incentive. Refinancing is the most rate-sensitive series in housing, and its collapse makes sense. Full-year 2026 existing sales are tracking toward roughly 4.09 million units and new sales toward 632,000, neither of which is consistent with a healthy housing market.
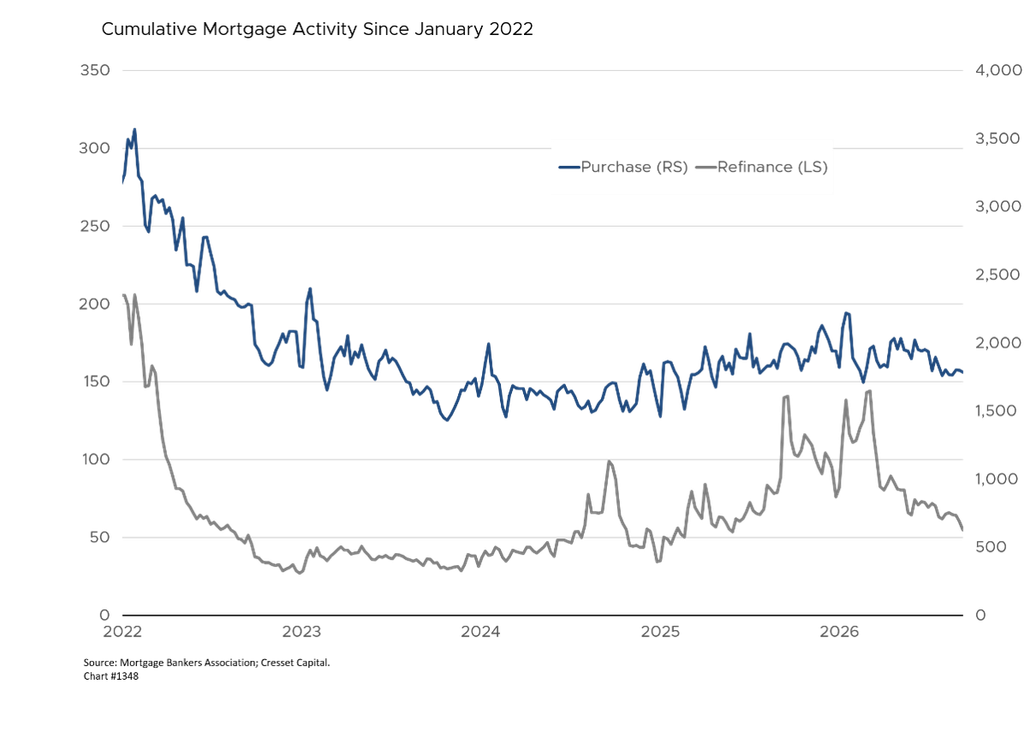
The mechanism holding this together is lock-in. Owners with sub-4% mortgages will not sell into a near-7% market, which simultaneously restricts inventory and transaction velocity. That is the reason prices hold while volumes collapse, and it means the market will not clear through ordinary price discovery.
Implications for the Economy
Residential investment, including construction, renovation, and broker commissions, contributes directly to GDP. With starts below 1.3 million and builder confidence at multiyear lows, that contribution is a headwind rather than a tailwind through 2026.
Home purchases drive spending on appliances, furniture, home improvements, and professional services. Elevated prices have supported household balance sheets through the wealth effect, but suppressed turnover reduces ancillary spending, which is the more economically active channel.
Residential construction employment is a reliable leading cyclical indicator. Persistent weakness in starts and permits eventually converts into reduced demand for trades and materials, presenting a softening force on an otherwise resilient jobs picture.
Housing sits at the center of the rate transmission mechanism, and lock-in effect has partially disabled it. Rates would need to fall substantially, not marginally, to unlock existing supply. Until mortgages approach 6% or below, the Fed faces a channel that transmits tightening efficiently and easing poorly. That asymmetry complicates the Fed’s actions in both directions.
The pullback in multifamily starts is disinflationary now, through weaker construction demand, and inflationary in 2028, through undersupplied rental stock. Shelter is the largest CPI component, so this is a live consideration for anyone with a multi-year inflation view.
Bottom Line
Housing has become a persistent headwind on the economy rather than an acute shock. At 15.8% of GDP, its lowest share since 2019, the sector is weighing on growth. The cheap mortgage lock-in effect keeps prices firm while low transaction volumes blunt monetary transmission, leaving the Fed with an outcome where higher rates hurt, but incrementally lower rates don’t necessarily help.
Politically, the lack of affordability has morphed from a passive complaint into a full-fledged grievance. Near-7% mortgages have split the electorate along a line that doesn’t map neatly into congressional maps, with existing homeowners holding sub-4% loans seeing their position protected, while renters and would-be first-time buyers face entry costs that look structural rather than cyclical. That asymmetry generates real pressure for intervention, though remedies such as zoning and permitting liberalization, construction subsidies, and buyer-side credits come with their own trade-offs. Young people frustrated by the lack of housing affordability, a cornerstone of the American Dream, are expected to show their displeasure at the polls.